Sallie Mae 2011 Annual Report Download - page 116
Download and view the complete annual report
Please find page 116 of the 2011 Sallie Mae annual report below. You can navigate through the pages in the report by either clicking on the pages listed below, or by using the keyword search tool below to find specific information within the annual report.-
 1
1 -
2
-
3
-
4
-
5
-
6
-
7
-
8
-
9
-
10
-
11
-
12
-
13
-
14
-
15
-
16
-
17
-
18
-
19
-
20
-
21
-
22
-
23
-
24
-
25
-
26
-
27
-
28
-
29
-
30
-
31
-
32
-
33
-
34
-
35
-
36
-
37
-
38
-
39
-
40
-
41
-
42
-
43
-
44
-
45
-
46
-
47
-
48
-
49
-
50
-
51
-
52
-
53
-
54
-
55
-
56
-
57
-
58
-
59
-
60
-
61
-
62
-
63
-
64
-
65
-
66
-
67
-
68
-
69
-
70
-
71
-
72
-
73
-
74
-
75
-
76
-
77
-
78
-
79
-
80
-
81
-
82
-
83
-
84
-
85
-
86
-
87
-
88
-
89
-
90
-
91
-
92
-
93
-
94
-
95
-
96
-
97
-
98
-
99
-
100
-
101
-
102
-
103
-
104
-
105
-
 106
106 -
 107
107 -
 108
108 -
 109
109 -
 110
110 -
 111
111 -
 112
112 -
 113
113 -
 114
114 -
 115
115 -
 116
116 -
 117
117 -
 118
118 -
 119
119 -
 120
120 -
 121
121 -
 122
122 -
 123
123 -
 124
124 -
 125
125 -
 126
126 -
127
-
128
-
129
-
130
-
131
-
132
-
133
-
134
-
135
-
136
-
137
-
138
-
139
-
140
-
141
-
142
-
143
-
144
-
145
-
146
-
147
-
148
-
149
-
150
-
151
-
152
-
153
-
154
-
155
-
156
-
157
-
158
-
159
-
160
-
161
-
162
-
163
-
164
-
165
-
166
-
167
-
168
-
169
-
170
-
171
-
172
-
173
-
174
-
175
-
176
-
177
-
178
-
179
-
180
-
181
-
182
-
183
-
184
-
185
-
186
-
187
-
188
-
189
-
190
-
191
-
192
-
193
-
194
-
195
-
196
-
197
-
198
-
199
-
200
-
201
-
202
-
203
-
204
-
205
-
206
-
207
-
208
-
209
-
210
-
211
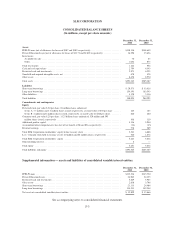
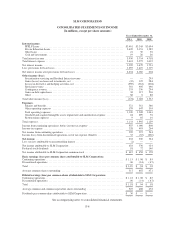
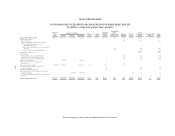
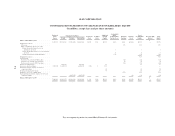
 |
 |

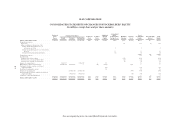
SLM CORPORATION
CONSOLIDATED STATEMENTS OF CHANGES IN STOCKHOLDERS’ EQUITY
(In millions, except share and per share amounts)
Preferred
Stock
Shares
Common Stock Shares Preferred
Stock
Common
Stock
Additional
Paid-In
Capital
Accumulated
Other
Comprehensive
Income (Loss)
Retained
Earnings
Treasury
Stock
Total
Stockholders’
Equity
Noncontrolling
Interest
Total
EquityIssued Treasury Outstanding
Balance at December 31, 2010 ................... 7,300,000 595,263,474 (68,319,589) 526,943,885 $565 $119 $ 5,940 $(45) $ 309 $(1,876) $5,012 $— $5,012
Comprehensive income:
Net income .................................. 633 633 (1) 632
Other comprehensive income, net of tax:
Change in unrealized gains (losses) on
investments, net of tax ..................... 222
Change in unrealized gains (losses) on derivatives,
netoftax ............................... 31 31 31
Defined benefit pension plans adjustment ........ (2) (2) (2)
Comprehensive income .......................... 664 (1) 663
Cash dividends:
Common stock ($.30 per share) .................. (154) (154) (154)
Preferred stock, series A ($3.49 per share) ......... (12) (12) (12)
Preferred stock, series B ($1.59 per share) ......... (6) (6) (6)
Issuance of common shares ....................... 3,886,217 3,886,217 1 40 41 41
Retirement of common stock in treasury ............. (70,074,369) 70,074,369 — (14) (1,890) 1,904 — —
Tax benefit related to employee stock-based
compensation plans ........................... (10) (10) (10)
Stock-based compensation expense ................ 56 56 56
Common stock repurchased ...................... (19,054,115) (19,054,115) (300) (300) (300)
Shares repurchased related to employee stock-based
compensation plans ........................... (3,024,662) (3,024,662) (48) (48) (48)
Acquisition of noncontrolling interest ............... —99
Balance at December 31, 2011 ................... 7,300,000 529,075,322 (20,323,997) 508,751,325 $565 $106 $ 4,136 $(14) $ 770 $ (320) $5,243 $ 8 $5,251
See accompanying notes to consolidated financial statements.
F-7