Sallie Mae 2011 Annual Report Download - page 193
Download and view the complete annual report
Please find page 193 of the 2011 Sallie Mae annual report below. You can navigate through the pages in the report by either clicking on the pages listed below, or by using the keyword search tool below to find specific information within the annual report.-
 1
1 -
2
-
3
-
4
-
5
-
6
-
7
-
8
-
9
-
10
-
11
-
12
-
13
-
14
-
15
-
16
-
17
-
18
-
19
-
20
-
21
-
22
-
23
-
24
-
25
-
26
-
27
-
28
-
29
-
30
-
31
-
32
-
33
-
34
-
35
-
36
-
37
-
38
-
39
-
40
-
41
-
42
-
43
-
44
-
45
-
46
-
47
-
48
-
49
-
50
-
51
-
52
-
53
-
54
-
55
-
56
-
57
-
58
-
59
-
60
-
61
-
62
-
63
-
64
-
65
-
66
-
67
-
68
-
69
-
70
-
71
-
72
-
73
-
74
-
75
-
76
-
77
-
78
-
79
-
80
-
81
-
82
-
83
-
84
-
85
-
86
-
87
-
88
-
89
-
90
-
91
-
92
-
93
-
94
-
95
-
96
-
97
-
98
-
99
-
100
-
101
-
102
-
103
-
104
-
105
-
106
-
107
-
108
-
109
-
110
-
111
-
112
-
113
-
114
-
115
-
116
-
117
-
118
-
119
-
120
-
121
-
122
-
123
-
124
-
125
-
126
-
127
-
128
-
129
-
130
-
131
-
132
-
133
-
134
-
135
-
136
-
137
-
138
-
139
-
140
-
141
-
142
-
143
-
144
-
145
-
146
-
147
-
148
-
149
-
150
-
151
-
152
-
153
-
154
-
155
-
156
-
157
-
158
-
159
-
160
-
161
-
162
-
163
-
164
-
165
-
166
-
167
-
168
-
169
-
170
-
171
-
172
-
173
-
174
-
175
-
176
-
177
-
178
-
179
-
180
-
181
-
182
-
 183
183 -
 184
184 -
 185
185 -
 186
186 -
 187
187 -
 188
188 -
 189
189 -
 190
190 -
 191
191 -
 192
192 -
 193
193 -
 194
194 -
 195
195 -
 196
196 -
 197
197 -
 198
198 -
 199
199 -
 200
200 -
 201
201 -
 202
202 -
 203
203 -
204
-
205
-
206
-
207
-
208
-
209
-
210
-
211
 |
 |
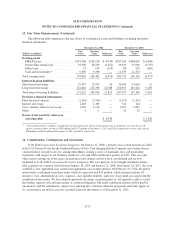
SLM CORPORATION
NOTES TO CONSOLIDATED FINANCIAL STATEMENTS (Continued)
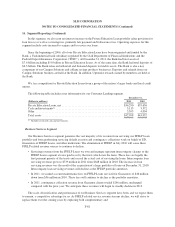
16. Segment Reporting (Continued)
Measure of Profitability
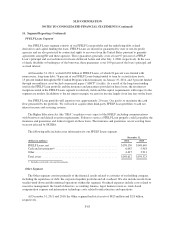
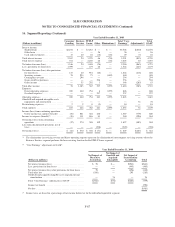
The tables below include the condensed operating results for each of our reportable segments. Management,
including the chief operating decision makers, evaluates the Company on certain performance measures that we
refer to as “Core Earnings” performance measures for each operating segment. We use “Core Earnings” to
manage each business segment because “Core Earnings” reflect adjustments to GAAP financial results for three
items, discussed below, that create significant volatility mostly due to timing factors generally beyond the control
of management. Accordingly, we believe that “Core Earnings” provide management with a useful basis from
which to better evaluate results from ongoing operations against the business plan or against results from prior
periods. Consequently, we disclose this information as we believe it provides investors with additional
information regarding the operational and performance indicators that are most closely assessed by management.
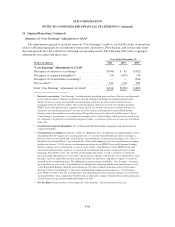
The three items adjusted for in our “Core Earnings” presentations are (1) our use of derivatives instruments to
hedge our economic risks that do not qualify for hedge accounting treatment or do qualify for hedge accounting
treatment but result in ineffectiveness and (2) the accounting for goodwill and acquired intangible assets and
(3) the off-balance sheet treatment of certain securitization transactions. The tables presented below reflect “Core
Earnings” operating measures reviewed and utilized by management to manage the business. Reconciliation of
the “Core Earnings” segment totals to our consolidated operating results in accordance with GAAP is also
included in the tables below.
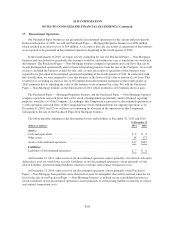
Our “Core Earnings” performance measures are not defined terms within GAAP and may not be comparable
to similarly titled measures reported by other companies. Unlike financial accounting, there is no comprehensive,
authoritative guidance for management reporting. The management reporting process measures the performance
of the operating segments based on the management structure of the Company and is not necessarily comparable
with similar information for any other financial institution. Our operating segments are defined by the products
and services they offer or the types of customers they serve, and they reflect the manner in which financial
information is currently evaluated by management. Intersegment revenues and expenses are netted within the
appropriate financial statement line items consistent with the income statement presentation provided to
management. Changes in management structure or allocation methodologies and procedures may result in
changes in reported segment financial information.
F-84