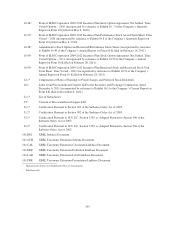
Sallie Mae 2011 Annual Report Download - page 117
Download and view the complete annual report
Please find page 117 of the 2011 Sallie Mae annual report below. You can navigate through the pages in the report by either clicking on the pages listed below, or by using the keyword search tool below to find specific information within the annual report.-
 1
1 -
2
-
3
-
4
-
5
-
6
-
7
-
8
-
9
-
10
-
11
-
12
-
13
-
14
-
15
-
16
-
17
-
18
-
19
-
20
-
21
-
22
-
23
-
24
-
25
-
26
-
27
-
28
-
29
-
30
-
31
-
32
-
33
-
34
-
35
-
36
-
37
-
38
-
39
-
40
-
41
-
42
-
43
-
44
-
45
-
46
-
47
-
48
-
49
-
50
-
51
-
52
-
53
-
54
-
55
-
56
-
57
-
58
-
59
-
60
-
61
-
62
-
63
-
64
-
65
-
66
-
67
-
68
-
69
-
70
-
71
-
72
-
73
-
74
-
75
-
76
-
77
-
78
-
79
-
80
-
81
-
82
-
83
-
84
-
85
-
86
-
87
-
88
-
89
-
90
-
91
-
92
-
93
-
94
-
95
-
96
-
97
-
98
-
99
-
100
-
101
-
102
-
103
-
104
-
105
-
106
-
 107
107 -
 108
108 -
 109
109 -
 110
110 -
 111
111 -
 112
112 -
 113
113 -
 114
114 -
 115
115 -
 116
116 -
 117
117 -
 118
118 -
 119
119 -
 120
120 -
 121
121 -
 122
122 -
 123
123 -
 124
124 -
 125
125 -
 126
126 -
 127
127 -
128
-
129
-
130
-
131
-
132
-
133
-
134
-
135
-
136
-
137
-
138
-
139
-
140
-
141
-
142
-
143
-
144
-
145
-
146
-
147
-
148
-
149
-
150
-
151
-
152
-
153
-
154
-
155
-
156
-
157
-
158
-
159
-
160
-
161
-
162
-
163
-
164
-
165
-
166
-
167
-
168
-
169
-
170
-
171
-
172
-
173
-
174
-
175
-
176
-
177
-
178
-
179
-
180
-
181
-
182
-
183
-
184
-
185
-
186
-
187
-
188
-
189
-
190
-
191
-
192
-
193
-
194
-
195
-
196
-
197
-
198
-
199
-
200
-
201
-
202
-
203
-
204
-
205
-
206
-
207
-
208
-
209
-
210
-
211
 |
 |

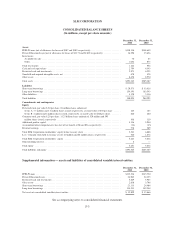
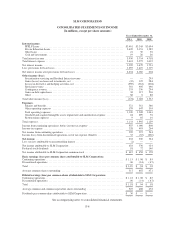
SLM CORPORATION
CONSOLIDATED STATEMENTS OF CASH FLOWS
(In millions)
Years Ended December 31,
2011 2010 2009
Operating activities
Net income attributable to SLM Corporation .................................................................. $ 633 $ 530 $ 324
Adjustments to reconcile net income to net cash provided by (used in) operating activities:
(Income) loss from discontinued operations, net of tax ........................................................ (33) 67 220
(Gains) losses on loans and investments, net ................................................................ 35 (6) 1
(Gains) on debt repurchases ............................................................................. (38) (317) (536)
Goodwill and acquired intangible assets impairment and amortization expense ..................................... 24 699 76
Stock-based compensation cost .......................................................................... 56 40 51
Unrealized (gains)/losses on derivative and hedging activities .................................................. 145 (478) 324
Provisions for loan losses ............................................................................... 1,295 1,419 1,119
Student loans originated for sale, net ...................................................................... — (9,648) (19,100)
Decrease (increase) in restricted cash — other ............................................................... 15 (2) 40
Decrease (increase) in accrued interest receivable ............................................................ 463 (4) 894
Increase (decrease) in accrued interest payable .............................................................. 75 (77) (517)
Adjustment for non-cash loss related to Retained Interest ...................................................... — — 330
Decrease in other assets ................................................................................ 423 1,206 375
(Decrease) in other liabilities ............................................................................ (12) (121) (30)
Cash provided by (used in) operating activities — continuing operations ............................................ 3,081 (6,692) (16,429)
Cash provided by operating activities — discontinued operations .................................................. — — 515
Total net cash provided by (used in) operating activities ......................................................... 3,081 (6,692) (15,914)
Investing activities
Student loans acquired ................................................................................. (3,888) (4,611) (5,973)
Loans purchased from securitized trusts — — (6)
Reduction of student loans:
Installment payments, claims and other .................................................................. 12,290 9,812 7,319
Proceeds from sales of student loans .................................................................... 753 588 788
Other investing activities, net ............................................................................ (210) (96) (419)
Purchases of available-for-sale securities ................................................................... (142) (38,303) (128,478)
Proceeds from maturities of available-for-sale securities ....................................................... 193 39,465 128,052
Purchases of held-to-maturity and other securities ............................................................ (277) (142) (1)
Proceeds from maturities of held-to-maturity securities and other securities ........................................ 265 136 79
Decrease (increase) in restricted cash — variable interest entities ................................................ 376 426 (1,180)
Cash provided by investing activities — continuing operations .................................................. 9,360 7,275 181
Cash provided by investing activities — discontinued operations ................................................ 114 139 130
Total net cash provided by investing activities ................................................................. 9,474 7,414 311
Financing activities
Borrowings collateralized by loans in trust — issued .......................................................... 4,553 5,917 12,998
Borrowings collateralized by loans in trust — repaid .......................................................... (13,408) (10,636) (5,690)
Asset-backed commercial paper conduits, net ............................................................... 887 (2,060) (16,138)
ED Participation Program, net ........................................................................... — 11,252 19,302
ED Conduit Program facility, net ......................................................................... (3,172) 664 14,314
Other short-term borrowings issued ....................................................................... 239 — 298
Other short-term borrowings repaid ....................................................................... (38) (168) (1,435)
Other long-term borrowings issued........................................................................ 2,354 1,464 4,333
Other long-term borrowings repaid ........................................................................ (6,498) (9,955) (9,504)
Other financing activities, net ............................................................................ 696 (21) (955)
Retail and other deposits, net ............................................................................ 754 1,166 204
Other ............................................................................................... 1 — (8)
Common stock repurchased ............................................................................. (300) — —
Common stock dividends paid ........................................................................... (154) — —
Preferred dividends paid ................................................................................ (18) (72) (116)
Net cash (used in) provided by financing activities ........................................................... (14,104) (2,449) 17,603
Net (decrease) increase in cash and cash equivalents ............................................................ (1,549) (1,727) 2,000
Cash and cash equivalents at beginning of year ................................................................ 4,343 6,070 4,070
Cash and cash equivalents at end of year ................................................................... $ 2,794 $ 4,343 $ 6,070
Cash disbursements made (refunds received) for:
Interest .............................................................................................. $ 2,413 $ 2,372 $ 3,657
Income taxes paid ..................................................................................... $ 559 $ 200 $ 328
Income taxes (received) ................................................................................ $ (37) $ (628) $ (30)
Noncash activity:
Investing activity — Student loans and other assets acquired ................................................... $ 783 $25,638 $ —
Operating activity — Other assets acquired and other liabilities assumed, net ...................................... $ 19 $ 376 $ —
Financing activity — Borrowings assumed in acquisition of student loans and other assets ............................ $ 802 $26,014 $ —
See accompanying notes to consolidated financial statements.
F-8