Sallie Mae 2011 Annual Report Download - page 36
Download and view the complete annual report
Please find page 36 of the 2011 Sallie Mae annual report below. You can navigate through the pages in the report by either clicking on the pages listed below, or by using the keyword search tool below to find specific information within the annual report.-
 1
1 -
2
-
3
-
4
-
5
-
6
-
7
-
8
-
9
-
10
-
11
-
12
-
13
-
14
-
15
-
16
-
17
-
18
-
19
-
20
-
21
-
22
-
23
-
24
-
25
-
 26
26 -
 27
27 -
 28
28 -
 29
29 -
 30
30 -
 31
31 -
 32
32 -
 33
33 -
 34
34 -
 35
35 -
 36
36 -
 37
37 -
 38
38 -
 39
39 -
 40
40 -
 41
41 -
 42
42 -
 43
43 -
 44
44 -
 45
45 -
 46
46 -
47
-
48
-
49
-
50
-
51
-
52
-
53
-
54
-
55
-
56
-
57
-
58
-
59
-
60
-
61
-
62
-
63
-
64
-
65
-
66
-
67
-
68
-
69
-
70
-
71
-
72
-
73
-
74
-
75
-
76
-
77
-
78
-
79
-
80
-
81
-
82
-
83
-
84
-
85
-
86
-
87
-
88
-
89
-
90
-
91
-
92
-
93
-
94
-
95
-
96
-
97
-
98
-
99
-
100
-
101
-
102
-
103
-
104
-
105
-
106
-
107
-
108
-
109
-
110
-
111
-
112
-
113
-
114
-
115
-
116
-
117
-
118
-
119
-
120
-
121
-
122
-
123
-
124
-
125
-
126
-
127
-
128
-
129
-
130
-
131
-
132
-
133
-
134
-
135
-
136
-
137
-
138
-
139
-
140
-
141
-
142
-
143
-
144
-
145
-
146
-
147
-
148
-
149
-
150
-
151
-
152
-
153
-
154
-
155
-
156
-
157
-
158
-
159
-
160
-
161
-
162
-
163
-
164
-
165
-
166
-
167
-
168
-
169
-
170
-
171
-
172
-
173
-
174
-
175
-
176
-
177
-
178
-
179
-
180
-
181
-
182
-
183
-
184
-
185
-
186
-
187
-
188
-
189
-
190
-
191
-
192
-
193
-
194
-
195
-
196
-
197
-
198
-
199
-
200
-
201
-
202
-
203
-
204
-
205
-
206
-
207
-
208
-
209
-
210
-
211
 |
 |
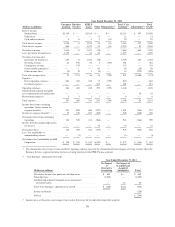
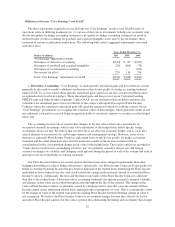
Consolidated Earnings Summary — GAAP-basis
Year Ended December 31, 2011 Compared with Year Ended December 31, 2010
For the years ended December 31, 2011 and 2010, net income was $633 million, or $1.18 diluted earnings
per common share, and $530 million, or $.94 diluted earnings per common share, respectively. The increase in
net income for the year ended December 31, 2011 as compared with the prior year period was primarily due to
$660 million of goodwill and intangible asset impairment charges, which were partially non-tax deductible,
recorded in the year-ago period, a $124 million decrease in the provisions for loan losses, a $100 million increase
in income from discontinued operations and $108 million of lower operating expenses. These improvements
were partially offset by a $598 million increase in net losses on derivative and hedging activities, a $279 million
decrease in gains on debt repurchases and a $360 million decrease in net gains on loans and investments.
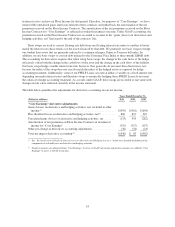
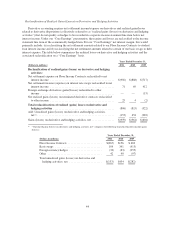
The primary contributors to each component of net income for the current year compared with the year-ago
period are as follows:
• Net interest income increased by $50 million primarily from incremental net interest income earned on
$25 billion of securitized FFELP loans acquired on December 31, 2010.
• Provisions for loan losses decreased by $124 million, as the $124 million of additional provision related
to the implementation of new accounting guidance for troubled debt restructurings (“TDRs”) in the third
quarter of 2011 (see “Consumer Lending Segment — Private Education Loans Provision for Loan Losses
and Charge-offs” for further discussion), was more than offset by overall improvements in credit quality
and delinquency and charge-off trends.
• Gains on loans and investments, net, declined $360 million as a result of a $321 million gain recognized
in the fourth quarter of 2010 from the sale of FFELP Loans to ED as part of the ED’s Loan Purchase
Commitment Program (the “Purchase Program”) which ended in 2010. Also, in 2011 we recorded $26
million of impairment on certain aircraft leases which were primarily related to leveraged lease
investments with American Airlines, which filed for bankruptcy in the fourth quarter of 2011. 2011 also
has a $9 million mark-to-market loss related to classifying our entire $12 million portfolio of non-U.S.
dollar-denominated student loans as held-for-sale.
• Net losses on derivatives and hedging activities increased by $598 million primarily due to interest rate
and foreign currency fluctuations, affecting the valuations of our Floor Income Contracts, basis swaps and
foreign currency hedges during the period. Valuations of derivative instruments vary based upon many
factors including changes in interest rates, credit risk, foreign currency fluctuations and other market
factors. As a result, net gains and losses on derivatives and hedging activities may vary significantly in
future periods.
• Servicing revenue decreased by $24 million primarily due to the end of FFELP in 2010, thereby
eliminating Guarantor issuance fees we earn on new FFELP Loans. Outstanding FFELP Loans on which
we earn additional fees also declined.
• Gains on debt repurchases decreased $279 million as we repurchased less debt in the current period. Debt
repurchase activity will fluctuate based on market fundamentals and our liability management strategy.
• Other income increased by $62 million primarily as a result of a $25 million gain from the termination
and replacement of a credit card affiliation contract and $27 million from an increase in foreign currency
translation gains. The foreign currency translation gains relate to a portion of our foreign currency
denominated debt that does not receive hedge accounting treatment. These gains were partially offset by
“losses on derivative and hedging activities, net” line item in the consolidated statements of income
related to the derivatives used to economically hedge these debt investments.
• Operating expenses decreased $108 million primarily as a result of our on-going cost savings initiative.
34