Sallie Mae 2011 Annual Report Download - page 5
Download and view the complete annual report
Please find page 5 of the 2011 Sallie Mae annual report below. You can navigate through the pages in the report by either clicking on the pages listed below, or by using the keyword search tool below to find specific information within the annual report.-
 1
1 -
 2
2 -
 3
3 -
 4
4 -
 5
5 -
 6
6 -
 7
7 -
 8
8 -
 9
9 -
 10
10 -
 11
11 -
 12
12 -
 13
13 -
 14
14 -
 15
15 -
 16
16 -
17
-
18
-
19
-
20
-
21
-
22
-
23
-
24
-
25
-
26
-
27
-
28
-
29
-
30
-
31
-
32
-
33
-
34
-
35
-
36
-
37
-
38
-
39
-
40
-
41
-
42
-
43
-
44
-
45
-
46
-
47
-
48
-
49
-
50
-
51
-
52
-
53
-
54
-
55
-
56
-
57
-
58
-
59
-
60
-
61
-
62
-
63
-
64
-
65
-
66
-
67
-
68
-
69
-
70
-
71
-
72
-
73
-
74
-
75
-
76
-
77
-
78
-
79
-
80
-
81
-
82
-
83
-
84
-
85
-
86
-
87
-
88
-
89
-
90
-
91
-
92
-
93
-
94
-
95
-
96
-
97
-
98
-
99
-
100
-
101
-
102
-
103
-
104
-
105
-
106
-
107
-
108
-
109
-
110
-
111
-
112
-
113
-
114
-
115
-
116
-
117
-
118
-
119
-
120
-
121
-
122
-
123
-
124
-
125
-
126
-
127
-
128
-
129
-
130
-
131
-
132
-
133
-
134
-
135
-
136
-
137
-
138
-
139
-
140
-
141
-
142
-
143
-
144
-
145
-
146
-
147
-
148
-
149
-
150
-
151
-
152
-
153
-
154
-
155
-
156
-
157
-
158
-
159
-
160
-
161
-
162
-
163
-
164
-
165
-
166
-
167
-
168
-
169
-
170
-
171
-
172
-
173
-
174
-
175
-
176
-
177
-
178
-
179
-
180
-
181
-
182
-
183
-
184
-
185
-
186
-
187
-
188
-
189
-
190
-
191
-
192
-
193
-
194
-
195
-
196
-
197
-
198
-
199
-
200
-
201
-
202
-
203
-
204
-
205
-
206
-
207
-
208
-
209
-
210
-
211
 |
 |

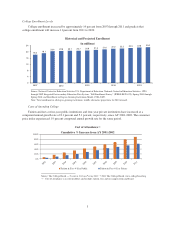
College Enrollment Levels
College enrollment increased by approximately 14 percent from 2007 through 2011 and predicts that
college-enrollment will increase 11 percent from 2011 to 2020.
Historical and Projected Enrollment
(in millions)
2007 2010 2013 2016 2019
0
4
8
12
16
20
24
18.2 19.1
20.4 20.6 20.7 20.7 20.9 21.3 21.6 22.0 22.2 22.5 22.8 23.0
Source: National Center for Education Statistics U.S. Department of Education, National Center for Education Statistics, 1990
through 2009 Integrated Postsecondary Education Data System, “Fall Enrollment Survey” (IPEDS-EF:90–99), Spring 2001 through
Spring 2010; and Enrollment in Degree-Granting Institutions Model, 1980–2009.
Note: Total enrollment in all degree-granting institutions; middle alternative projections for 2010 onward.
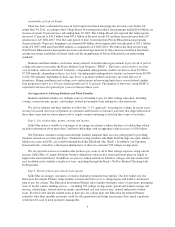
Costs of Attending College
Tuition and fees at four-year public institutions and four-year private institutions have increased at a
compound annual growth rate of 8.1 percent and 5.1 percent, respectively, since AY 2001-2002. The consumer
price index experienced 1.9 percent compound annual growth rate for the same period.
Cost of Attendance(1)
Cumulative % Increase from AY 2001-2002
100%
80%
60%
40%
20%
0%
2002
2003
2004
2005
2006
2007
2008
2009
2010
2011
Tuition & Fees 4-Year Public Tuition & Fees 4-Year Private
Source: The College Board — Trends in College Pricing 2011.©2011 The College Board. www.collegeboard.org
(1) Cost of attendance is in current dollars and includes tuition, fees and on-campus room and board.
3