Sallie Mae 2011 Annual Report Download - page 113
Download and view the complete annual report
Please find page 113 of the 2011 Sallie Mae annual report below. You can navigate through the pages in the report by either clicking on the pages listed below, or by using the keyword search tool below to find specific information within the annual report.-
 1
1 -
2
-
3
-
4
-
5
-
6
-
7
-
8
-
9
-
10
-
11
-
12
-
13
-
14
-
15
-
16
-
17
-
18
-
19
-
20
-
21
-
22
-
23
-
24
-
25
-
26
-
27
-
28
-
29
-
30
-
31
-
32
-
33
-
34
-
35
-
36
-
37
-
38
-
39
-
40
-
41
-
42
-
43
-
44
-
45
-
46
-
47
-
48
-
49
-
50
-
51
-
52
-
53
-
54
-
55
-
56
-
57
-
58
-
59
-
60
-
61
-
62
-
63
-
64
-
65
-
66
-
67
-
68
-
69
-
70
-
71
-
72
-
73
-
74
-
75
-
76
-
77
-
78
-
79
-
80
-
81
-
82
-
83
-
84
-
85
-
86
-
87
-
88
-
89
-
90
-
91
-
92
-
93
-
94
-
95
-
96
-
97
-
98
-
99
-
100
-
101
-
102
-
 103
103 -
 104
104 -
 105
105 -
 106
106 -
 107
107 -
 108
108 -
 109
109 -
 110
110 -
 111
111 -
 112
112 -
 113
113 -
 114
114 -
 115
115 -
 116
116 -
 117
117 -
 118
118 -
 119
119 -
 120
120 -
 121
121 -
 122
122 -
 123
123 -
124
-
125
-
126
-
127
-
128
-
129
-
130
-
131
-
132
-
133
-
134
-
135
-
136
-
137
-
138
-
139
-
140
-
141
-
142
-
143
-
144
-
145
-
146
-
147
-
148
-
149
-
150
-
151
-
152
-
153
-
154
-
155
-
156
-
157
-
158
-
159
-
160
-
161
-
162
-
163
-
164
-
165
-
166
-
167
-
168
-
169
-
170
-
171
-
172
-
173
-
174
-
175
-
176
-
177
-
178
-
179
-
180
-
181
-
182
-
183
-
184
-
185
-
186
-
187
-
188
-
189
-
190
-
191
-
192
-
193
-
194
-
195
-
196
-
197
-
198
-
199
-
200
-
201
-
202
-
203
-
204
-
205
-
206
-
207
-
208
-
209
-
210
-
211
 |
 |

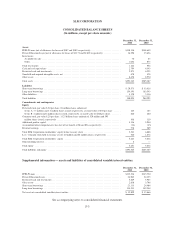
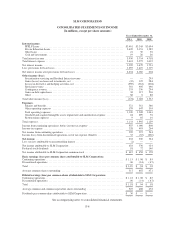
SLM CORPORATION
CONSOLIDATED STATEMENTS OF INCOME
(In millions, except per share amounts)
Years Ended December 31,
2011 2010 2009
Interest income:
FFELP Loans ................................................................. $3,461 $3,345 $3,094
Private Education Loans ........................................................ 2,429 2,353 1,582
Other loans .................................................................. 21 30 56
Cash and investments .......................................................... 19 26 26
Total interest income ............................................................. 5,930 5,754 4,758
Total interest expense ............................................................ 2,401 2,275 3,035
Net interest income .............................................................. 3,529 3,479 1,723
Less: provisions for loan losses ..................................................... 1,295 1,419 1,119
Net interest income after provisions for loan losses ..................................... 2,234 2,060 604
Other income (loss):
Securitization servicing and Residual Interest revenue ................................. — — 295
Gains (losses) on loans and investments, net ........................................ (35) 325 284
Losses on derivative and hedging activities, net ...................................... (959) (361) (604)
Servicing revenue ............................................................. 381 405 440
Contingency revenue ........................................................... 333 330 294
Gains on debt repurchases ....................................................... 38 317 536
Other ....................................................................... 68 6 88
Total other income (loss) .......................................................... (174) 1,022 1,333
Expenses:
Salaries and benefits ........................................................... 521 561 540
Other operating expenses ....................................................... 579 647 503
Total operating expenses ........................................................ 1,100 1,208 1,043
Goodwill and acquired intangible assets impairment and amortization expense ............. 24 699 76
Restructuring expenses ......................................................... 9 85 10
Total expenses .................................................................. 1,133 1,992 1,129
Income from continuing operations, before income tax expense ........................... 927 1,090 808
Income tax expense .............................................................. 328 493 264
Net income from continuing operations .............................................. 599 597 544
Income (loss) from discontinued operations, net of tax expense (benefit) .................... 33 (67) (220)
Net income .................................................................... 632 530 324
Less: net loss attributable to noncontrolling interest ..................................... (1) — —
Net income attributable to SLM Corporation .......................................... 633 530 324
Preferred stock dividends ......................................................... 18 72 146
Net income attributable to SLM Corporation common stock .............................. $ 615 $ 458 $ 178
Basic earnings (loss) per common share attributable to SLM Corporation:
Continuing operations ............................................................ $ 1.13 $ 1.08 $ .85
Discontinued operations .......................................................... .06 (.14) (.47)
Total ......................................................................... $ 1.19 $ .94 $ .38
Average common shares outstanding ................................................ 517 487 471
Diluted earnings (loss) per common share attributable to SLM Corporation:
Continuing operations ............................................................ $ 1.12 $ 1.08 $ .85
Discontinued operations .......................................................... .06 (.14) (.47)
Total ......................................................................... $ 1.18 $ .94 $ .38
Average common and common equivalent shares outstanding ............................ 523 488 472
Dividends per common share attributable to SLM Corporation ............................ $ .30 $ — $ —
See accompanying notes to consolidated financial statements.
F-4