Sallie Mae 2011 Annual Report Download - page 81
Download and view the complete annual report
Please find page 81 of the 2011 Sallie Mae annual report below. You can navigate through the pages in the report by either clicking on the pages listed below, or by using the keyword search tool below to find specific information within the annual report.-
 1
1 -
2
-
3
-
4
-
5
-
6
-
7
-
8
-
9
-
10
-
11
-
12
-
13
-
14
-
15
-
16
-
17
-
18
-
19
-
20
-
21
-
22
-
23
-
24
-
25
-
26
-
27
-
28
-
29
-
30
-
31
-
32
-
33
-
34
-
35
-
36
-
37
-
38
-
39
-
40
-
41
-
42
-
43
-
44
-
45
-
46
-
47
-
48
-
49
-
50
-
51
-
52
-
53
-
54
-
55
-
56
-
57
-
58
-
59
-
60
-
61
-
62
-
63
-
64
-
65
-
66
-
67
-
68
-
69
-
70
-
 71
71 -
 72
72 -
 73
73 -
 74
74 -
 75
75 -
 76
76 -
 77
77 -
 78
78 -
 79
79 -
 80
80 -
 81
81 -
 82
82 -
 83
83 -
 84
84 -
 85
85 -
 86
86 -
 87
87 -
 88
88 -
 89
89 -
 90
90 -
 91
91 -
92
-
93
-
94
-
95
-
96
-
97
-
98
-
99
-
100
-
101
-
102
-
103
-
104
-
105
-
106
-
107
-
108
-
109
-
110
-
111
-
112
-
113
-
114
-
115
-
116
-
117
-
118
-
119
-
120
-
121
-
122
-
123
-
124
-
125
-
126
-
127
-
128
-
129
-
130
-
131
-
132
-
133
-
134
-
135
-
136
-
137
-
138
-
139
-
140
-
141
-
142
-
143
-
144
-
145
-
146
-
147
-
148
-
149
-
150
-
151
-
152
-
153
-
154
-
155
-
156
-
157
-
158
-
159
-
160
-
161
-
162
-
163
-
164
-
165
-
166
-
167
-
168
-
169
-
170
-
171
-
172
-
173
-
174
-
175
-
176
-
177
-
178
-
179
-
180
-
181
-
182
-
183
-
184
-
185
-
186
-
187
-
188
-
189
-
190
-
191
-
192
-
193
-
194
-
195
-
196
-
197
-
198
-
199
-
200
-
201
-
202
-
203
-
204
-
205
-
206
-
207
-
208
-
209
-
210
-
211
 |
 |

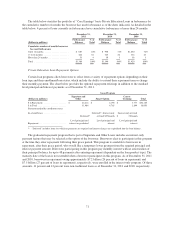
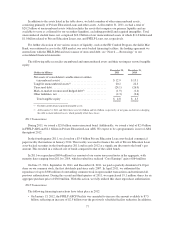
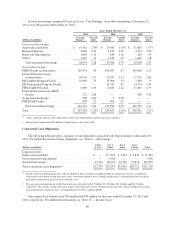
The table below highlights exposure related to our derivative counterparties at December 31, 2011.
(Dollars in millions)
SLM Corporation
and Sallie Mae Bank
Contracts
Securitization Trust
Contracts(1)
Exposure, net of collateral .......................... $113 $807
Percent of exposure to counterparties with credit ratings
below S&P AA- or Moody’s Aa3 ................... 98% 32%
Percent of exposure to counterparties with credit ratings
below S&P A- or Moody’s A3 ..................... 0% 0%
(1) Current turmoil in the European markets has led to increased disclosure of exposure to those markets. Of the total net exposure,
$691 million is related to financial institutions located in France; of this amount, $498 million carries a guarantee from the
French government. $690 million of the $691 million exposure relates to derivatives held at our securitization trusts.
Counterparties to these derivatives are required to post collateral when their credit rating is withdrawn or downgraded below a
certain level. As of December 31, 2011, no collateral was required to be posted. Adjustments are made to our derivative
valuations for counterparty credit risk. The adjustments made at December 31, 2011 related to derivatives with French financial
institutions (including those that carry a guarantee from the French government) decreased the derivative asset value by
$179 million. Credit risks for all derivative counterparties are assessed internally on a continual basis.
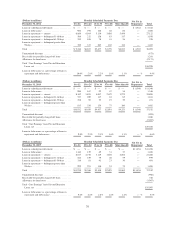
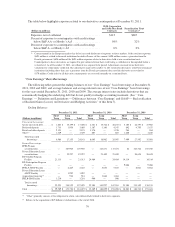
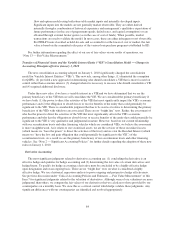
“Core Earnings” Basis Borrowings
The following tables present the ending balances of our “Core Earnings” basis borrowings at December 31,
2011, 2010 and 2009, and average balances and average interest rates of our “Core Earnings” basis borrowings
for the years ended December 31, 2011, 2010 and 2009. The average interest rates include derivatives that are
economically hedging the underlying debt but do not qualify for hedge accounting treatment. (See “‘Core
Earnings’ — Definition and Limitations — Differences between ‘Core Earnings’ and GAAP — Reclassification
of Realized Gains (Losses) on Derivative and Hedging Activities” of this Item 7).
Ending Balances
December 31, 2011 December 31, 2010 December 31, 2009
(Dollars in millions)
Short
Term
Long
Term Total
Short
Term
Long
Term Total
Short
Term
Long
Term Total
Unsecured borrowings:
Senior unsecured debt ....... $ 1,801 $ 15,199 $ 17,000 $ 4,361 $ 15,742 $ 20,103 $ 5,185 $ 22,797 $ 27,982
Brokered deposits .......... 1,733 1,956 3,689 1,387 3,160 4,547 842 4,795 5,637
Retail and other deposits .... 2,123 — 2,123 1,370 — 1,370 204 — 204
Other(1) .................. 1,329 — 1,329 887 — 887 1,268 — 1,268
Total unsecured
borrowings ........... 6,986 17,155 24,141 8,005 18,902 26,907 7,499 27,592 35,091
Secured borrowings:
FFELP Loans
securitizations ........... — 107,905 107,905 — 113,671 113,671 64 103,724 103,788
Private Education Loans
securitizations ........... — 19,297 19,297 — 21,409 21,409 — 20,624 20,624
ED Conduit Program
Facility ................ 21,313 — 21,313 24,484 — 24,484 14,314 — 14,314
ED Participation Program
Facility ................ — — — — — — 9,006 — 9,006
FFELP ABCP Facility ...... — 4,445 4,445 — 5,853 5,853 — 8,801 8,801
Private Education Loans
ABCP Facility .......... — 1,992 1,992 — — — — — —
Acquisition financing(2) ..... — 916 916 — 1,064 1,064 — — —
FHLB-DM Facility ......... 1,210 — 1,210 900 — 900 — — —
Total secured
borrowings ........... 22,523 134,555 157,078 25,384 141,997 167,381 23,384 133,149 156,533
Total .................... $ 29,509 $ 151,710 $ 181,219 $ 33,389 $ 160,899 $ 194,288 $ 30,883 $ 160,741 $ 191,624
(1) “Other” primarily consists of the obligation to return cash collateral held related to derivative exposure.
(2) Relates to the acquisition of $25 billion of student loans at the end of 2010.
79