Sallie Mae 2011 Annual Report Download - page 76
Download and view the complete annual report
Please find page 76 of the 2011 Sallie Mae annual report below. You can navigate through the pages in the report by either clicking on the pages listed below, or by using the keyword search tool below to find specific information within the annual report.-
 1
1 -
2
-
3
-
4
-
5
-
6
-
7
-
8
-
9
-
10
-
11
-
12
-
13
-
14
-
15
-
16
-
17
-
18
-
19
-
20
-
21
-
22
-
23
-
24
-
25
-
26
-
27
-
28
-
29
-
30
-
31
-
32
-
33
-
34
-
35
-
36
-
37
-
38
-
39
-
40
-
41
-
42
-
43
-
44
-
45
-
46
-
47
-
48
-
49
-
50
-
51
-
52
-
53
-
54
-
55
-
56
-
57
-
58
-
59
-
60
-
61
-
62
-
63
-
64
-
65
-
 66
66 -
 67
67 -
 68
68 -
 69
69 -
 70
70 -
 71
71 -
 72
72 -
 73
73 -
 74
74 -
 75
75 -
 76
76 -
 77
77 -
 78
78 -
 79
79 -
 80
80 -
 81
81 -
 82
82 -
 83
83 -
 84
84 -
 85
85 -
 86
86 -
87
-
88
-
89
-
90
-
91
-
92
-
93
-
94
-
95
-
96
-
97
-
98
-
99
-
100
-
101
-
102
-
103
-
104
-
105
-
106
-
107
-
108
-
109
-
110
-
111
-
112
-
113
-
114
-
115
-
116
-
117
-
118
-
119
-
120
-
121
-
122
-
123
-
124
-
125
-
126
-
127
-
128
-
129
-
130
-
131
-
132
-
133
-
134
-
135
-
136
-
137
-
138
-
139
-
140
-
141
-
142
-
143
-
144
-
145
-
146
-
147
-
148
-
149
-
150
-
151
-
152
-
153
-
154
-
155
-
156
-
157
-
158
-
159
-
160
-
161
-
162
-
163
-
164
-
165
-
166
-
167
-
168
-
169
-
170
-
171
-
172
-
173
-
174
-
175
-
176
-
177
-
178
-
179
-
180
-
181
-
182
-
183
-
184
-
185
-
186
-
187
-
188
-
189
-
190
-
191
-
192
-
193
-
194
-
195
-
196
-
197
-
198
-
199
-
200
-
201
-
202
-
203
-
204
-
205
-
206
-
207
-
208
-
209
-
210
-
211
 |
 |

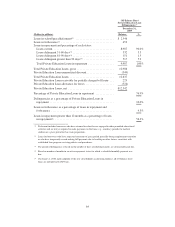
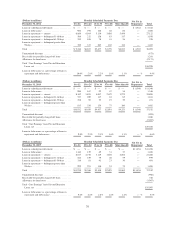
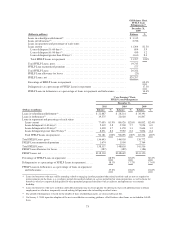
Allowance for FFELP Loan Losses
The following table summarizes changes in the allowance for FFELP Loan losses.
Activity in Allowance for FFELP Loans
GAAP-Basis
Years Ended December 31,
Off-Balance Sheet
Years Ended December 31,
“Core Earnings” Basis
Years Ended December 31,
(Dollars in millions) 2011 2010 2009 2011 2010(1) 2009 2011 2010 2009
Allowance at beginning of
period ..................... $ 189 $ 161 $ 138 $— $ 25 $ 27 $ 189 $ 186 $ 165
Provision for FFELP Loan
losses ...................... 86 98 106 — — 13 86 98 119
Charge-offs ................... (78) (87) (79) — — (15) (78) (87) (94)
Student loan sales and
securitization activity ......... (10) (8) (4) — — — (10) (8) (4)
Consolidation of securitization
trusts(1) ..................... — 25 — — (25) ————
Allowance at end of period ....... $ 187 $ 189 $ 161 $— $— $ 25 $ 187 $ 189 $ 186
Charge-offs as a percentage of
average loans in repayment ..... .08% .11% .11% — % — % .10% .08% .11% .11%
Charge-offs as a percentage of
average loans in repayment and
forbearance ................. .07% .09% .10% — % — % .09% .07% .09% .09%
Allowance as a percentage of the
ending total loans, gross ....... .14% .13% .14% — % — % .13% .14% .13% .13%
Allowance as a percentage of
ending loans in repayment ..... .20% .20% .23% — % — % .18% .20% .20% .22%
Allowance coverage of
charge-offs ................. 2.4 2.2 2.0 — — 1.7 2.4 2.2 2.0
Ending total loans, gross ......... $136,643 $146,938 $119,027 $— $— $19,745 $136,643 $146,938 $138,772
Average loans in repayment ...... $ 94,359 $ 82,255 $ 69,020 $— $— $14,293 $ 94,359 $ 82,255 $ 83,313
Ending loans in repayment ....... $ 94,181 $ 96,696 $ 69,827 $— $— $13,707 $ 94,181 $ 96,696 $ 83,534
(1) Upon the adoption of the new consolidation accounting guidance on January 1, 2010, we consolidated all of our off-balance sheet
securitization trusts.
74