Sallie Mae 2011 Annual Report Download - page 182
Download and view the complete annual report
Please find page 182 of the 2011 Sallie Mae annual report below. You can navigate through the pages in the report by either clicking on the pages listed below, or by using the keyword search tool below to find specific information within the annual report.-
 1
1 -
2
-
3
-
4
-
5
-
6
-
7
-
8
-
9
-
10
-
11
-
12
-
13
-
14
-
15
-
16
-
17
-
18
-
19
-
20
-
21
-
22
-
23
-
24
-
25
-
26
-
27
-
28
-
29
-
30
-
31
-
32
-
33
-
34
-
35
-
36
-
37
-
38
-
39
-
40
-
41
-
42
-
43
-
44
-
45
-
46
-
47
-
48
-
49
-
50
-
51
-
52
-
53
-
54
-
55
-
56
-
57
-
58
-
59
-
60
-
61
-
62
-
63
-
64
-
65
-
66
-
67
-
68
-
69
-
70
-
71
-
72
-
73
-
74
-
75
-
76
-
77
-
78
-
79
-
80
-
81
-
82
-
83
-
84
-
85
-
86
-
87
-
88
-
89
-
90
-
91
-
92
-
93
-
94
-
95
-
96
-
97
-
98
-
99
-
100
-
101
-
102
-
103
-
104
-
105
-
106
-
107
-
108
-
109
-
110
-
111
-
112
-
113
-
114
-
115
-
116
-
117
-
118
-
119
-
120
-
121
-
122
-
123
-
124
-
125
-
126
-
127
-
128
-
129
-
130
-
131
-
132
-
133
-
134
-
135
-
136
-
137
-
138
-
139
-
140
-
141
-
142
-
143
-
144
-
145
-
146
-
147
-
148
-
149
-
150
-
151
-
152
-
153
-
154
-
155
-
156
-
157
-
158
-
159
-
160
-
161
-
162
-
163
-
164
-
165
-
166
-
167
-
168
-
169
-
170
-
171
-
 172
172 -
 173
173 -
 174
174 -
 175
175 -
 176
176 -
 177
177 -
 178
178 -
 179
179 -
 180
180 -
 181
181 -
 182
182 -
 183
183 -
 184
184 -
 185
185 -
 186
186 -
 187
187 -
 188
188 -
 189
189 -
 190
190 -
 191
191 -
 192
192 -
193
-
194
-
195
-
196
-
197
-
198
-
199
-
200
-
201
-
202
-
203
-
204
-
205
-
206
-
207
-
208
-
209
-
210
-
211
 |
 |

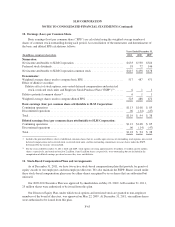
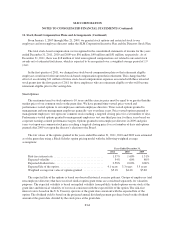
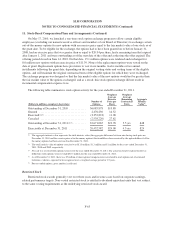
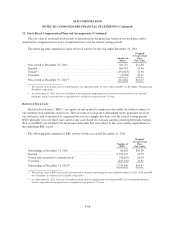
SLM CORPORATION
NOTES TO CONSOLIDATED FINANCIAL STATEMENTS (Continued)
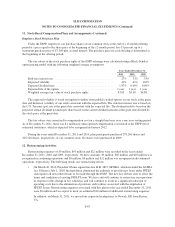
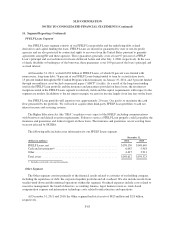
13. Fair Value Measurements (Continued)
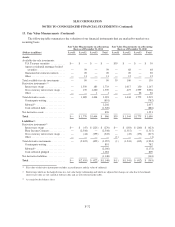
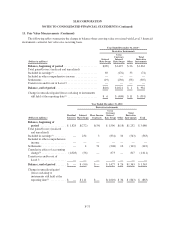
The following tables summarize the change in balance sheet carrying value associated with Level 3 financial
instruments carried at fair value on a recurring basis.
Year Ended December 31, 2011(3)
Derivative Instruments
(Dollars in millions)
Interest
Rate Swaps
Cross
Currency
Interest
Rate Swaps Other
Total
Derivative
Instruments
Balance, beginning of period ........................ $(90) $1,427 $ 26 $1,363
Total gains/(losses) (realized and unrealized):
Included in earnings(1) .............................. 69 (176) 33 (74)
Included in other comprehensive income ............... — — — —
Settlements ....................................... (19) (230) (58) (307)
Transfers in and/or out of Level 3 ..................... — — — —
Balance, end of period ............................. $(40) $1,021 $ 1 $ 982
Change in unrealized gains/(losses) relating to instruments
still held at the reporting date(2) ..................... $ 6 $ (408) $ 11 $ (391)
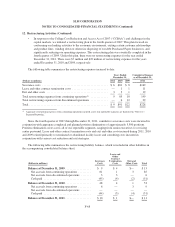
Year Ended December 31, 2010
Derivative instruments
(Dollars in millions)
Residual
Interests
Interest
Rate Swaps
Floor Income
Contracts
Cross
Currency
Interest
Rate Swaps Other
Total
Derivative
Instruments Total
Balance, beginning of
period .................. $1,828 $(272) $(54) $ 1,596 $(18) $1,252 $ 3,080
Total gains/(losses) (realized
and unrealized):
Included in earnings(1) ........ — 234 3 (834) 34 (563) (563)
Included in other comprehensive
income .................. — — — — — — —
Settlements ................ — 4 51 (208) 10 (143) (143)
Cumulative effect of accounting
change(3) ................. (1,828) (56) — 873 — 817 (1,011)
Transfers in and/or out of
Level 3 .................. — — — — — — —
Balance, end of period ....... $ — $ (90) $ — $ 1,427 $ 26 $1,363 $ 1,363
Change in unrealized gains/
(losses) relating to
instruments still held at the
reporting date(2) ........... $ — $111 $— $(1,010) $ 36 $ (863) $ (863)
F-73