Sallie Mae 2011 Annual Report Download - page 71
Download and view the complete annual report
Please find page 71 of the 2011 Sallie Mae annual report below. You can navigate through the pages in the report by either clicking on the pages listed below, or by using the keyword search tool below to find specific information within the annual report.-
 1
1 -
2
-
3
-
4
-
5
-
6
-
7
-
8
-
9
-
10
-
11
-
12
-
13
-
14
-
15
-
16
-
17
-
18
-
19
-
20
-
21
-
22
-
23
-
24
-
25
-
26
-
27
-
28
-
29
-
30
-
31
-
32
-
33
-
34
-
35
-
36
-
37
-
38
-
39
-
40
-
41
-
42
-
43
-
44
-
45
-
46
-
47
-
48
-
49
-
50
-
51
-
52
-
53
-
54
-
55
-
56
-
57
-
58
-
59
-
60
-
 61
61 -
 62
62 -
 63
63 -
 64
64 -
 65
65 -
 66
66 -
 67
67 -
 68
68 -
 69
69 -
 70
70 -
 71
71 -
 72
72 -
 73
73 -
 74
74 -
 75
75 -
 76
76 -
 77
77 -
 78
78 -
 79
79 -
 80
80 -
 81
81 -
82
-
83
-
84
-
85
-
86
-
87
-
88
-
89
-
90
-
91
-
92
-
93
-
94
-
95
-
96
-
97
-
98
-
99
-
100
-
101
-
102
-
103
-
104
-
105
-
106
-
107
-
108
-
109
-
110
-
111
-
112
-
113
-
114
-
115
-
116
-
117
-
118
-
119
-
120
-
121
-
122
-
123
-
124
-
125
-
126
-
127
-
128
-
129
-
130
-
131
-
132
-
133
-
134
-
135
-
136
-
137
-
138
-
139
-
140
-
141
-
142
-
143
-
144
-
145
-
146
-
147
-
148
-
149
-
150
-
151
-
152
-
153
-
154
-
155
-
156
-
157
-
158
-
159
-
160
-
161
-
162
-
163
-
164
-
165
-
166
-
167
-
168
-
169
-
170
-
171
-
172
-
173
-
174
-
175
-
176
-
177
-
178
-
179
-
180
-
181
-
182
-
183
-
184
-
185
-
186
-
187
-
188
-
189
-
190
-
191
-
192
-
193
-
194
-
195
-
196
-
197
-
198
-
199
-
200
-
201
-
202
-
203
-
204
-
205
-
206
-
207
-
208
-
209
-
210
-
211
 |
 |

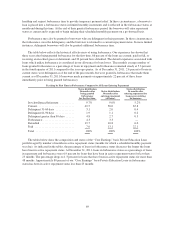
hardship and request forbearance time to provide temporary payment relief. In these circumstances, a borrower’s
loan is placed into a forbearance status in limited monthly increments and is reflected in the forbearance status at
month-end during this time. At the end of their granted forbearance period, the borrower will enter repayment
status as current and is expected to begin making their scheduled monthly payments on a go-forward basis.
Forbearance may also be granted to borrowers who are delinquent in their payments. In these circumstances,
the forbearance cures the delinquency and the borrower is returned to a current repayment status. In more limited
instances, delinquent borrowers will also be granted additional forbearance time.
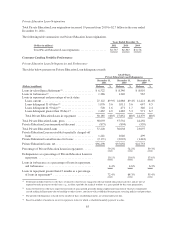
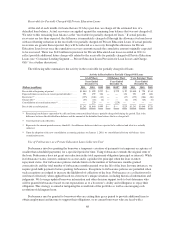
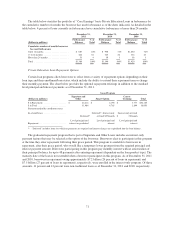
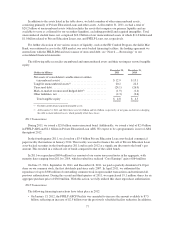
The table below reflects the historical effectiveness of using forbearance. Our experience has shown that
three years after being granted forbearance for the first time, 66 percent of the loans are current, paid in full, or
receiving an in-school grace or deferment, and 20 percent have defaulted. The default experience associated with
loans which utilize forbearance is considered in our allowance for loan losses. The monthly average number of
loans granted forbearance as a percentage of loans in repayment and forbearance remained steady at 5.3 percent
in the fourth quarter of 2011 compared to the year-ago quarter. As of December 31, 2011, 2.6 percent of loans in
current status were delinquent as of the end of the prior month, but were granted a forbearance that made them
current as of December 31, 2011 (borrowers made payments on approximately 22 percent of these loans
immediately prior to being granted forbearance).
Tracking by First Time in Forbearance Compared to All Loans Entering Repayment
Status distribution
36 months after
being granted
forbearance
for the first time
Status distribution
36 months after
entering repayment
(all loans)
Status distribution
36 months after
entering repayment for
loans never entering
forbearance
In-school/grace/deferment .......... 9.7% 9.0% 5.2%
Current .......................... 49.5 58.0 65.8
Delinquent 31-60 days ............. 3.1 2.0 0.4
Delinquent 61-90 days ............. 1.9 1.1 0.2
Delinquent greater than 90 days ...... 4.8 2.7 0.3
Forbearance ...................... 4.3 3.3 —
Defaulted ........................ 19.7 10.8 6.0
Paid ............................ 7.0 13.1 22.1
Total ........................... 100% 100% 100%
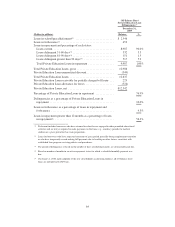
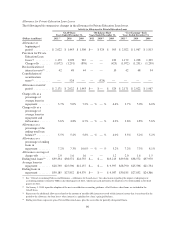
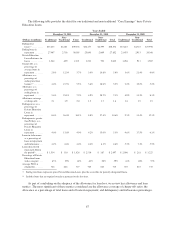
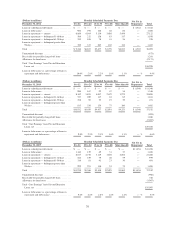
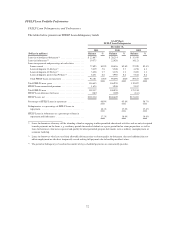
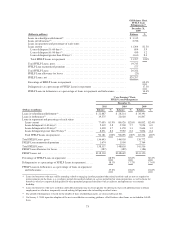
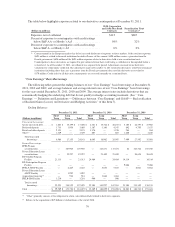
The tables below show the composition and status of the “Core Earnings” basis Private Education Loan
portfolio aged by number of months in active repayment status (months for which a scheduled monthly payment
was due). As indicated in the tables, the percentage of loans in forbearance status decreases the longer the loans
have been in active repayment status. At December 31, 2011, loans in forbearance status as a percentage of loans
in repayment and forbearance were 6.9 percent for loans that have been in active repayment status for less than
25 months. The percentage drops to 1.3 percent for loans that have been in active repayment status for more than
48 months. Approximately 80 percent of our “Core Earnings” basis Private Education Loans in forbearance
status has been in active repayment status less than 25 months.
69