Sallie Mae 2011 Annual Report Download - page 55
Download and view the complete annual report
Please find page 55 of the 2011 Sallie Mae annual report below. You can navigate through the pages in the report by either clicking on the pages listed below, or by using the keyword search tool below to find specific information within the annual report.-
 1
1 -
2
-
3
-
4
-
5
-
6
-
7
-
8
-
9
-
10
-
11
-
12
-
13
-
14
-
15
-
16
-
17
-
18
-
19
-
20
-
21
-
22
-
23
-
24
-
25
-
26
-
27
-
28
-
29
-
30
-
31
-
32
-
33
-
34
-
35
-
36
-
37
-
38
-
39
-
40
-
41
-
42
-
43
-
44
-
 45
45 -
 46
46 -
 47
47 -
 48
48 -
 49
49 -
 50
50 -
 51
51 -
 52
52 -
 53
53 -
 54
54 -
 55
55 -
 56
56 -
 57
57 -
 58
58 -
 59
59 -
 60
60 -
 61
61 -
 62
62 -
 63
63 -
 64
64 -
 65
65 -
66
-
67
-
68
-
69
-
70
-
71
-
72
-
73
-
74
-
75
-
76
-
77
-
78
-
79
-
80
-
81
-
82
-
83
-
84
-
85
-
86
-
87
-
88
-
89
-
90
-
91
-
92
-
93
-
94
-
95
-
96
-
97
-
98
-
99
-
100
-
101
-
102
-
103
-
104
-
105
-
106
-
107
-
108
-
109
-
110
-
111
-
112
-
113
-
114
-
115
-
116
-
117
-
118
-
119
-
120
-
121
-
122
-
123
-
124
-
125
-
126
-
127
-
128
-
129
-
130
-
131
-
132
-
133
-
134
-
135
-
136
-
137
-
138
-
139
-
140
-
141
-
142
-
143
-
144
-
145
-
146
-
147
-
148
-
149
-
150
-
151
-
152
-
153
-
154
-
155
-
156
-
157
-
158
-
159
-
160
-
161
-
162
-
163
-
164
-
165
-
166
-
167
-
168
-
169
-
170
-
171
-
172
-
173
-
174
-
175
-
176
-
177
-
178
-
179
-
180
-
181
-
182
-
183
-
184
-
185
-
186
-
187
-
188
-
189
-
190
-
191
-
192
-
193
-
194
-
195
-
196
-
197
-
198
-
199
-
200
-
201
-
202
-
203
-
204
-
205
-
206
-
207
-
208
-
209
-
210
-
211
 |
 |

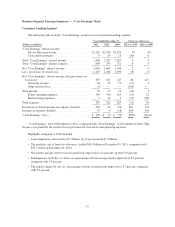
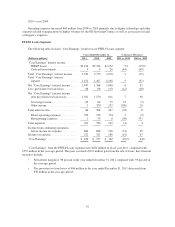
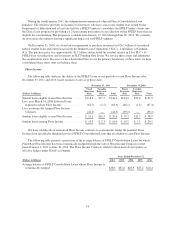
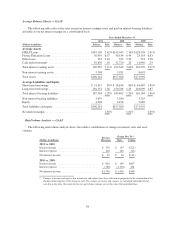
FFELP Loans Net Interest Margin
The following table shows the FFELP Loans “Core Earnings” net interest margin along with reconciliation
to the GAAP-basis FFELP Loans net interest margin.
Years Ended December 31,
2011 2010 2009
“Core Earnings” basis FFELP student loan yield .... 2.59% 2.57% 2.68%
Hedged Floor Income .......................... .25 .23 .14
Unhedged Floor Income ........................ .12 .02 .22
Consolidation Loan Rebate Fees ................. (.65) (.59) (.59)
Repayment Borrower Benefits ................... (.12) (.10) (.11)
Premium amortization ......................... (.15) (.18) (.17)
“Core Earnings” basis FFELP student loan net
yield ..................................... 2.04 1.95 2.17
“Core Earnings” basis FFELP student loan cost of
funds ..................................... (.98) (.93) (1.44)
“Core Earnings” basis FFELP student loan spread . . . 1.06 1.02 .73
“Core Earnings” basis FFELP other asset spread
impact .................................... (.08) (.09) (.06)
“Core Earnings” basis FFELP Loans net interest
margin(1) .................................. .98% .93% .67%
“Core Earnings” basis FFELP Loans net interest
margin(1) .................................. .98% .93% .67%
Adjustment for GAAP accounting treatment ........ .34 .33 (.08)
GAAP-basis FFELP Loans net interest margin ...... 1.32% 1.26% .59%
(1) The average balances of our FFELP “Core Earnings” basis interest-earning assets for the respective periods are:
(Dollars in millions)
FFELP Loans ............................................. $143,109 $142,043 $150,059
Other interest-earning assets .................................. 5,194 5,562 5,126
Total FFELP “Core Earnings” basis interest-earning assets .......... $148,303 $147,605 $155,185
The increase in the “Core Earnings” basis FFELP Loans net interest margin of 5 basis points for 2011
compared with 2010 was primarily the result of an increase in Floor Income due to lower interest rates.
The “Core Earnings” basis FFELP Loans net interest margin for 2010 increased by 26 basis points from
2009. This was primarily the result of a significant reduction in the cost of our ABCP Facility, a 24 basis point
improvement in the CP/LIBOR Spread and a significantly higher margin on the loans within the ED’s Loan
Participation Purchase Program (the “Participation Program”) facility compared with the prior year.
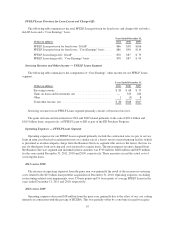
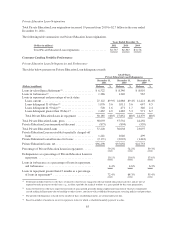
As of December 31, 2011, our FFELP Loan portfolio totaled approximately $138.1 billion, comprised of
$50.4 billion of FFELP Stafford and $87.7 billion of FFELP Consolidation Loans. The weighted-average life of
these portfolios is 5.0 years and 9.2 years, respectively, assuming a Constant Prepayment Rate (“CPR”) of
5 percent and 3 percent, respectively.
On December 23, 2011, the President signed the Consolidated Appropriations Act of 2012 into law. This
law includes changes that permit FFELP lenders or beneficial holders to change the index on which the Special
Allowance Payments (“SAP”) are calculated for FFELP Loans first disbursed on or after January 1, 2000. The
law allows holders to elect to move the index from the Commercial Paper (“CP”) Rate to the one-month LIBOR
rate. Such elections must be made by April 1, 2012. As of December 31, 2011, we had $130 billion of loans
where we intend to elect the change. This change will help us to better match lender payments with our financing
costs. We currently expect the new formula to be developed and available for use in the second quarter of 2012.
53