Sallie Mae 2011 Annual Report Download - page 135
Download and view the complete annual report
Please find page 135 of the 2011 Sallie Mae annual report below. You can navigate through the pages in the report by either clicking on the pages listed below, or by using the keyword search tool below to find specific information within the annual report.-
 1
1 -
2
-
3
-
4
-
5
-
6
-
7
-
8
-
9
-
10
-
11
-
12
-
13
-
14
-
15
-
16
-
17
-
18
-
19
-
20
-
21
-
22
-
23
-
24
-
25
-
26
-
27
-
28
-
29
-
30
-
31
-
32
-
33
-
34
-
35
-
36
-
37
-
38
-
39
-
40
-
41
-
42
-
43
-
44
-
45
-
46
-
47
-
48
-
49
-
50
-
51
-
52
-
53
-
54
-
55
-
56
-
57
-
58
-
59
-
60
-
61
-
62
-
63
-
64
-
65
-
66
-
67
-
68
-
69
-
70
-
71
-
72
-
73
-
74
-
75
-
76
-
77
-
78
-
79
-
80
-
81
-
82
-
83
-
84
-
85
-
86
-
87
-
88
-
89
-
90
-
91
-
92
-
93
-
94
-
95
-
96
-
97
-
98
-
99
-
100
-
101
-
102
-
103
-
104
-
105
-
106
-
107
-
108
-
109
-
110
-
111
-
112
-
113
-
114
-
115
-
116
-
117
-
118
-
119
-
120
-
121
-
122
-
123
-
124
-
 125
125 -
 126
126 -
 127
127 -
 128
128 -
 129
129 -
 130
130 -
 131
131 -
 132
132 -
 133
133 -
 134
134 -
 135
135 -
 136
136 -
 137
137 -
 138
138 -
 139
139 -
 140
140 -
 141
141 -
 142
142 -
 143
143 -
 144
144 -
 145
145 -
146
-
147
-
148
-
149
-
150
-
151
-
152
-
153
-
154
-
155
-
156
-
157
-
158
-
159
-
160
-
161
-
162
-
163
-
164
-
165
-
166
-
167
-
168
-
169
-
170
-
171
-
172
-
173
-
174
-
175
-
176
-
177
-
178
-
179
-
180
-
181
-
182
-
183
-
184
-
185
-
186
-
187
-
188
-
189
-
190
-
191
-
192
-
193
-
194
-
195
-
196
-
197
-
198
-
199
-
200
-
201
-
202
-
203
-
204
-
205
-
206
-
207
-
208
-
209
-
210
-
211
 |
 |

SLM CORPORATION
NOTES TO CONSOLIDATED FINANCIAL STATEMENTS (Continued)
3. Student Loans (Continued)
Allowance Payments (“SAP”) are calculated for FFELP Loans first disbursed on or after January 1, 2000. The
law allows holders to elect to move the index from the Commercial Paper (“CP”) Rate to the one-month LIBOR
rate. Such elections must be made by April 1, 2012. As of December 31, 2011, we had $130 billion of loans
where we intend to elect the change. This change will help us to better match lender payments with our financing
costs. We currently expect the new formula to be developed and available for use in the second quarter of 2012.
We offer a variety of Private Education Loans. The Private Education Loans we make are largely to bridge
the gap between the cost of higher education and the amount funded through financial aid, federal loans or
borrowers’ resources. Private Education Loans bear the full credit risk of the borrower. We manage this
additional risk through historical risk-performance underwriting strategies and the addition of qualified
cosigners. Private Education Loans generally carry a variable rate indexed to LIBOR or Prime indices. We
encourage borrowers to include a cosignor on the loan, and the majority of loans in our portfolio are cosigned.
Similar to FFELP loans, Private Education Loans are generally non-dischargeable in bankruptcy. Most loans
have repayment terms of 15 years or more, and payments are typically deferred until after graduation; however,
in June 2009 we began to offer interest-only or fixed payment options while the borrower is enrolled in school.
Similar to FFELP loans, we offer payment deferment to qualifying borrowers during in-school periods, and offer
periods of forbearance subject to maximum terms of 24 months. Forbearance may be granted to borrowers who
are exiting their grace period to provide additional time to obtain employment and income to support their
obligations, or to current borrowers who are faced with a hardship and request forbearance time to provide
temporary payment relief. Interest continues to accrue on loans in any deferred or forbearance period.
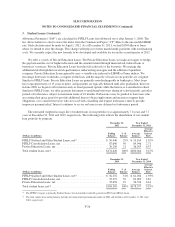
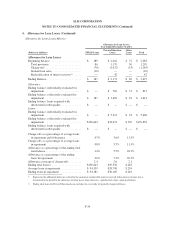
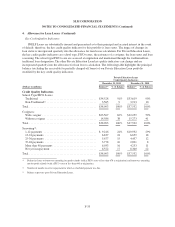
The estimated weighted average life of student loans in our portfolio was approximately 7.6 years and 7.7
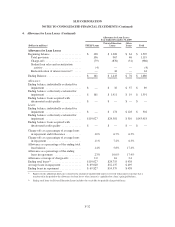
years at December 31, 2011 and 2010, respectively. The following table reflects the distribution of our student
loan portfolio by program.
December 31,
2011
Year Ended
December 31, 2011
(Dollars in millions)
Ending
Balance
%of
Balance
Average
Balance
Average
Effective
Interest
Rate
FFELP Stafford and Other Student Loans, net(1) .................. $ 50,440 29% $ 53,163 1.92%
FFELP Consolidation Loans, net .............................. 87,690 50 89,946 2.71
Private Education Loans, net ................................. 36,290 21 36,955 6.57
Total student loans, net(2) .................................... $174,420 100% $180,064 3.27%
December 31,
2010
Year Ended
December 31, 2010
(Dollars in millions)
Ending
Balance
%of
Balance
Average
Balance
Average
Effective
Interest
Rate
FFELP Stafford and Other Student Loans, net(1) .................. $ 56,252 31% $ 61,034 1.93%
FFELP Consolidation Loans, net .............................. 92,397 50 81,009 2.67
Private Education Loans, net ................................. 35,656 19 36,534 6.44
Total student loans, net(2) .................................... $184,305 100% $178,577 3.19%
(1) The FFELP category is primarily Stafford Loans, but also includes federally guaranteed PLUS and HEAL Loans.
(2) The total student loan ending balance includes net unamortized premiums/discounts of $801 and $1,006 as of December 31, 2011 and
2010, respectively.
F-26