Sallie Mae 2011 Annual Report Download - page 167
Download and view the complete annual report
Please find page 167 of the 2011 Sallie Mae annual report below. You can navigate through the pages in the report by either clicking on the pages listed below, or by using the keyword search tool below to find specific information within the annual report.-
 1
1 -
2
-
3
-
4
-
5
-
6
-
7
-
8
-
9
-
10
-
11
-
12
-
13
-
14
-
15
-
16
-
17
-
18
-
19
-
20
-
21
-
22
-
23
-
24
-
25
-
26
-
27
-
28
-
29
-
30
-
31
-
32
-
33
-
34
-
35
-
36
-
37
-
38
-
39
-
40
-
41
-
42
-
43
-
44
-
45
-
46
-
47
-
48
-
49
-
50
-
51
-
52
-
53
-
54
-
55
-
56
-
57
-
58
-
59
-
60
-
61
-
62
-
63
-
64
-
65
-
66
-
67
-
68
-
69
-
70
-
71
-
72
-
73
-
74
-
75
-
76
-
77
-
78
-
79
-
80
-
81
-
82
-
83
-
84
-
85
-
86
-
87
-
88
-
89
-
90
-
91
-
92
-
93
-
94
-
95
-
96
-
97
-
98
-
99
-
100
-
101
-
102
-
103
-
104
-
105
-
106
-
107
-
108
-
109
-
110
-
111
-
112
-
113
-
114
-
115
-
116
-
117
-
118
-
119
-
120
-
121
-
122
-
123
-
124
-
125
-
126
-
127
-
128
-
129
-
130
-
131
-
132
-
133
-
134
-
135
-
136
-
137
-
138
-
139
-
140
-
141
-
142
-
143
-
144
-
145
-
146
-
147
-
148
-
149
-
150
-
151
-
152
-
153
-
154
-
155
-
156
-
 157
157 -
 158
158 -
 159
159 -
 160
160 -
 161
161 -
 162
162 -
 163
163 -
 164
164 -
 165
165 -
 166
166 -
 167
167 -
 168
168 -
 169
169 -
 170
170 -
 171
171 -
 172
172 -
 173
173 -
 174
174 -
 175
175 -
 176
176 -
 177
177 -
178
-
179
-
180
-
181
-
182
-
183
-
184
-
185
-
186
-
187
-
188
-
189
-
190
-
191
-
192
-
193
-
194
-
195
-
196
-
197
-
198
-
199
-
200
-
201
-
202
-
203
-
204
-
205
-
206
-
207
-
208
-
209
-
210
-
211
 |
 |

SLM CORPORATION
NOTES TO CONSOLIDATED FINANCIAL STATEMENTS (Continued)
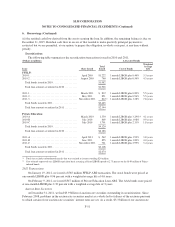
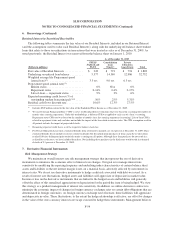
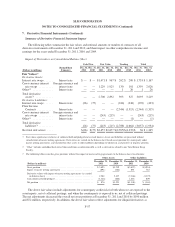
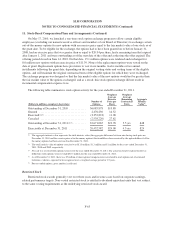
7. Derivative Financial Instruments (Continued)
indicated by a wide bid/ask spread in the interest rate indices to which the derivatives are indexed. These
adjustments decreased the overall net asset positions at December 31, 2011 and 2010 by $111 million and
$129 million, respectively.
Cash Flow Fair Value Trading Total
(Dollars in billions)
Dec. 31,
2011
Dec. 31,
2010
Dec. 31,
2011
Dec. 31,
2010
Dec. 31,
2011
Dec. 31,
2010
Dec. 31,
2011
Dec. 31,
2010
Notional Values:
Interest rate swaps ........................... $1.1 $1.6 $14.0 $13.5 $ 73.6 $118.9 $ 88.7 $134.0
Floor Income Contracts ....................... — — — — 57.8 39.3 57.8 39.3
Cross currency interest rate swaps ............... — — 15.5 17.5 .3 .3 15.8 17.8
Other(1) .................................... — — — — 1.4 1.0 1.4 1.0
Total derivatives ............................. $1.1 $1.6 $29.5 $31.0 $133.1 $159.5 $163.7 $192.1
(1) “Other” includes embedded derivatives bifurcated from securitization debt, as well as derivatives related to our Total Return Swap
Facility.
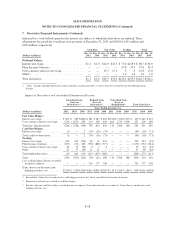
Impact of Derivatives on Consolidated Statements of Income
Unrealized Gain
(Loss) on
Derivatives(1)(2)
Realized Gain
(Loss) on
Derivatives(3)
Unrealized Gain
(Loss) on
Hedged Item(1) Total Gain (Loss)
Years Ended December 31,
(Dollars in millions) 2011 2010 2009 2011 2010 2009 2011 2010 2009 2011 2010 2009
Fair Value Hedges:
Interest rate swaps ............... $503 $ 289 $(801)$ 481 $ 487 $ 403 $(554) $ (334)$ 850 $ 430 $ 442 $ 452
Cross currency interest rate swaps . . . (723) (1,871) 692 314 348 440 664 1,732 (934) 255 209 198
Total fair value derivatives ......... (220) (1,582) (109) 795 835 843 110 1,398 (84) 685 651 650
Cash Flow Hedges:
Interest rate swaps ............... (1) — 2 (39) (58) (75) — — — (40) (58) (73)
Total cash flow derivatives ......... (1) — 2 (39) (58) (75) — — — (40) (58) (73)
Trading:
Interest rate swaps ............... 183 412 (526) 69 11 433 — — — 252 423 (93)
Floor Income Contracts ........... (267) 156 483 (903) (888) (717) — — — (1,170) (732) (234)
Cross currency interest rate swaps . . . 29 57 (26) 8 7 4 — — — 37 64 (22)
Other .......................... 22 37 (64) 11 31 — — — — 33 68 (64)
Total trading derivatives ........... (33) 662 (133) (815) (839) (280) — — — (848) (177) (413)
Total .......................... (254) (920) (240) (59) (62) 488 110 1,398 (84) (203) 416 164
Less: realized gains (losses) recorded
in interest expense ............. — — — 756 777 768 — — — 756 777 768
Gains (losses) on derivative and
hedging activities, net ........... $(254) $ (920) $(240) $(815)$(839) $(280)$ 110 $1,398 $ (84)$ (959) $(361) $(604)
(1) Recorded in “Gains (losses) on derivative and hedging activities, net” in the consolidated statements of income.
(2) Represents ineffectiveness related to cash flow hedges.
(3) For fair value and cash flow hedges, recorded in interest expense. For trading derivatives, recorded in “Gains (losses) on derivative and
hedging activities, net.”
F-58