Sallie Mae 2011 Annual Report Download - page 171
Download and view the complete annual report
Please find page 171 of the 2011 Sallie Mae annual report below. You can navigate through the pages in the report by either clicking on the pages listed below, or by using the keyword search tool below to find specific information within the annual report.-
 1
1 -
2
-
3
-
4
-
5
-
6
-
7
-
8
-
9
-
10
-
11
-
12
-
13
-
14
-
15
-
16
-
17
-
18
-
19
-
20
-
21
-
22
-
23
-
24
-
25
-
26
-
27
-
28
-
29
-
30
-
31
-
32
-
33
-
34
-
35
-
36
-
37
-
38
-
39
-
40
-
41
-
42
-
43
-
44
-
45
-
46
-
47
-
48
-
49
-
50
-
51
-
52
-
53
-
54
-
55
-
56
-
57
-
58
-
59
-
60
-
61
-
62
-
63
-
64
-
65
-
66
-
67
-
68
-
69
-
70
-
71
-
72
-
73
-
74
-
75
-
76
-
77
-
78
-
79
-
80
-
81
-
82
-
83
-
84
-
85
-
86
-
87
-
88
-
89
-
90
-
91
-
92
-
93
-
94
-
95
-
96
-
97
-
98
-
99
-
100
-
101
-
102
-
103
-
104
-
105
-
106
-
107
-
108
-
109
-
110
-
111
-
112
-
113
-
114
-
115
-
116
-
117
-
118
-
119
-
120
-
121
-
122
-
123
-
124
-
125
-
126
-
127
-
128
-
129
-
130
-
131
-
132
-
133
-
134
-
135
-
136
-
137
-
138
-
139
-
140
-
141
-
142
-
143
-
144
-
145
-
146
-
147
-
148
-
149
-
150
-
151
-
152
-
153
-
154
-
155
-
156
-
157
-
158
-
159
-
160
-
 161
161 -
 162
162 -
 163
163 -
 164
164 -
 165
165 -
 166
166 -
 167
167 -
 168
168 -
 169
169 -
 170
170 -
 171
171 -
 172
172 -
 173
173 -
 174
174 -
 175
175 -
 176
176 -
 177
177 -
 178
178 -
 179
179 -
 180
180 -
 181
181 -
182
-
183
-
184
-
185
-
186
-
187
-
188
-
189
-
190
-
191
-
192
-
193
-
194
-
195
-
196
-
197
-
198
-
199
-
200
-
201
-
202
-
203
-
204
-
205
-
206
-
207
-
208
-
209
-
210
-
211
 |
 |

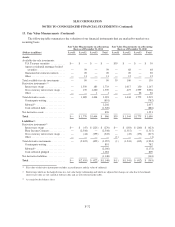
SLM CORPORATION
NOTES TO CONSOLIDATED FINANCIAL STATEMENTS (Continued)
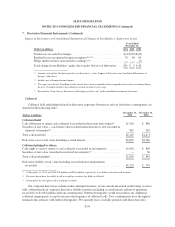
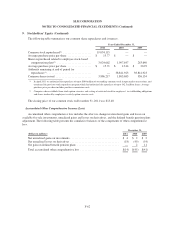
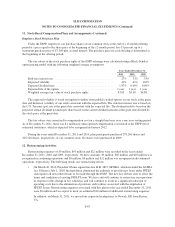
9. Stockholders’ Equity (Continued)
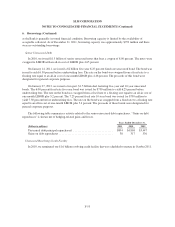
The following table summarizes our common share repurchases and issuances.
Years Ended December 31,
2011 2010 2009
Common stock repurchased(1) .................... 19,054,115 — —
Average purchase price per share ................. $ 15.77 $ — $ —
Shares repurchased related to employee stock-based
compensation plans(2) ........................ 3,024,662 1,097,647 263,640
Average purchase price per share ................. $ 15.71 $ 13.44 $ 20.29
Authority remaining at end of period for
repurchases(1) ............................... — 38,841,923 38,841,923
Common shares issued ......................... 3,886,217 1,803,683 536,134
(1) In April 2011 we authorized the repurchase of up to $300 million of outstanding common stock in open market transactions, and
terminated the previous stock repurchase program which had authorized the repurchase of up to 342.5 million shares. Average
purchase price per share includes purchase commission costs.
(2) Comprises shares withheld from stock option exercises and vesting of restricted stock for employees’ tax withholding obligations
and shares tendered by employees to satisfy option exercise costs.
The closing price of our common stock on December 31, 2011 was $13.40.
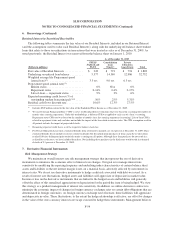
Accumulated Other Comprehensive Income (Loss)
Accumulated other comprehensive loss includes the after-tax change in unrealized gains and losses on
available-for-sale investments, unrealized gains and losses on derivatives, and the defined benefit pension plans
adjustment. The following table presents the cumulative balances of the components of other comprehensive
loss.
(Dollars in millions)
December 31,
2011 2010 2009
Net unrealized gains on investments .................................. $ 4 $ 2 $ 2
Net unrealized losses on derivatives .................................. (18) (49) (54)
Net gain on defined benefit pension plans ............................. — 2 11
Total accumulated other comprehensive loss ........................... $(14) $(45) $(41)
F-62