Sallie Mae 2011 Annual Report Download - page 33
Download and view the complete annual report
Please find page 33 of the 2011 Sallie Mae annual report below. You can navigate through the pages in the report by either clicking on the pages listed below, or by using the keyword search tool below to find specific information within the annual report.-
 1
1 -
2
-
3
-
4
-
5
-
6
-
7
-
8
-
9
-
10
-
11
-
12
-
13
-
14
-
15
-
16
-
17
-
18
-
19
-
20
-
21
-
22
-
 23
23 -
 24
24 -
 25
25 -
 26
26 -
 27
27 -
 28
28 -
 29
29 -
 30
30 -
 31
31 -
 32
32 -
 33
33 -
 34
34 -
 35
35 -
 36
36 -
 37
37 -
 38
38 -
 39
39 -
 40
40 -
 41
41 -
 42
42 -
 43
43 -
44
-
45
-
46
-
47
-
48
-
49
-
50
-
51
-
52
-
53
-
54
-
55
-
56
-
57
-
58
-
59
-
60
-
61
-
62
-
63
-
64
-
65
-
66
-
67
-
68
-
69
-
70
-
71
-
72
-
73
-
74
-
75
-
76
-
77
-
78
-
79
-
80
-
81
-
82
-
83
-
84
-
85
-
86
-
87
-
88
-
89
-
90
-
91
-
92
-
93
-
94
-
95
-
96
-
97
-
98
-
99
-
100
-
101
-
102
-
103
-
104
-
105
-
106
-
107
-
108
-
109
-
110
-
111
-
112
-
113
-
114
-
115
-
116
-
117
-
118
-
119
-
120
-
121
-
122
-
123
-
124
-
125
-
126
-
127
-
128
-
129
-
130
-
131
-
132
-
133
-
134
-
135
-
136
-
137
-
138
-
139
-
140
-
141
-
142
-
143
-
144
-
145
-
146
-
147
-
148
-
149
-
150
-
151
-
152
-
153
-
154
-
155
-
156
-
157
-
158
-
159
-
160
-
161
-
162
-
163
-
164
-
165
-
166
-
167
-
168
-
169
-
170
-
171
-
172
-
173
-
174
-
175
-
176
-
177
-
178
-
179
-
180
-
181
-
182
-
183
-
184
-
185
-
186
-
187
-
188
-
189
-
190
-
191
-
192
-
193
-
194
-
195
-
196
-
197
-
198
-
199
-
200
-
201
-
202
-
203
-
204
-
205
-
206
-
207
-
208
-
209
-
210
-
211
 |
 |
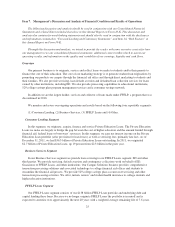
2012 Management Objectives
In 2012 we have set out five major goals to create shareholder value. They are: (1) prudently grow
Consumer Lending segment assets and revenue; (2) sustain Business Services segment revenue; (3) maximize
cash flows from FFELP Loans; (4) reduce our operating expenses; and (5) improve our financial strength. Here is
how we plan to achieve these objectives:
Prudently Grow Consumer Lending Segment Assets and Revenues
We will continue to pursue managed growth in our Private Education Loan portfolio in 2012, currently
targeting $3.2 billion in new originations for the year compared to $2.7 billion in 2011. We will also be
increasing our efforts to improve our return on these assets projecting even lower charge-off rates and provision
for loan losses, continuing to build on the improvements we have been demonstrating in these measures since
2009.
Sustain Business Services Segment Revenue
Our Business Services segment generates the vast majority of its revenue from servicing and collecting on
our FFELP Loan portfolio and FFELP Loans for others. As a result of the elimination of FFELP in 2010,
servicing and collection revenues derived from FFELP-related sources are in decline. In 2012 we will work to
offset these declines through two primary means—pursuing additional growth and expansion of our non-FFELP -
related servicing and collection businesses and seeking to increase the FFELP-related loan servicing and
collection work we do for third parties. In 2012 we are targeting significant growth in the number of customers
we service for ED under our ED servicing and collection contracts, as well as in the total assets under
management in our 529 college-savings plans. We will explore both complementary and diversified strategies to
expand demand for our services in and beyond the student loan market. We will also more aggressively seek to
leverage our existing FFELP servicing platforms to be able to provide lower cost FFELP servicing to others
while increasing segment revenues from these sources.
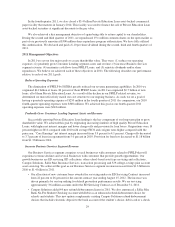
Maximize Cash Flows from FFELP Loans
In 2012 we will continue to focus on opportunistically purchasing additional FFELP Loan portfolios from
other lenders. As cash flows from our existing FFELP Loans decline over coming years, it also becomes
increasingly important that we actively manage and continue to reduce operating and overhead costs attributable
to the maintenance and management of this segment. Continuing to reduce these operating and overhead costs
will also increase net income for our Business Services segment.
Reduce Operating Expenses
We achieved our 2011 management objective of having a quarterly operating expense of $250 million or
less in the fourth quarter of 2011. In 2012 we will strive to sustain or improve on this quarterly run rate for the
full fiscal year.
Improve Our Financial Strength
In January 2012 we announced an increase in our quarterly dividend to $0.125 per share and a new $500
million common share repurchase program. Of equal note, it is management’s objective for 2012 to provide these
increased shareholder distributions while at the same time ending 2012 with a balance sheet and capital positions
as strong or stronger than those with which we ended in 2011.
31