Sallie Mae 2011 Annual Report Download - page 54
Download and view the complete annual report
Please find page 54 of the 2011 Sallie Mae annual report below. You can navigate through the pages in the report by either clicking on the pages listed below, or by using the keyword search tool below to find specific information within the annual report.-
 1
1 -
2
-
3
-
4
-
5
-
6
-
7
-
8
-
9
-
10
-
11
-
12
-
13
-
14
-
15
-
16
-
17
-
18
-
19
-
20
-
21
-
22
-
23
-
24
-
25
-
26
-
27
-
28
-
29
-
30
-
31
-
32
-
33
-
34
-
35
-
36
-
37
-
38
-
39
-
40
-
41
-
42
-
43
-
 44
44 -
 45
45 -
 46
46 -
 47
47 -
 48
48 -
 49
49 -
 50
50 -
 51
51 -
 52
52 -
 53
53 -
 54
54 -
 55
55 -
 56
56 -
 57
57 -
 58
58 -
 59
59 -
 60
60 -
 61
61 -
 62
62 -
 63
63 -
 64
64 -
65
-
66
-
67
-
68
-
69
-
70
-
71
-
72
-
73
-
74
-
75
-
76
-
77
-
78
-
79
-
80
-
81
-
82
-
83
-
84
-
85
-
86
-
87
-
88
-
89
-
90
-
91
-
92
-
93
-
94
-
95
-
96
-
97
-
98
-
99
-
100
-
101
-
102
-
103
-
104
-
105
-
106
-
107
-
108
-
109
-
110
-
111
-
112
-
113
-
114
-
115
-
116
-
117
-
118
-
119
-
120
-
121
-
122
-
123
-
124
-
125
-
126
-
127
-
128
-
129
-
130
-
131
-
132
-
133
-
134
-
135
-
136
-
137
-
138
-
139
-
140
-
141
-
142
-
143
-
144
-
145
-
146
-
147
-
148
-
149
-
150
-
151
-
152
-
153
-
154
-
155
-
156
-
157
-
158
-
159
-
160
-
161
-
162
-
163
-
164
-
165
-
166
-
167
-
168
-
169
-
170
-
171
-
172
-
173
-
174
-
175
-
176
-
177
-
178
-
179
-
180
-
181
-
182
-
183
-
184
-
185
-
186
-
187
-
188
-
189
-
190
-
191
-
192
-
193
-
194
-
195
-
196
-
197
-
198
-
199
-
200
-
201
-
202
-
203
-
204
-
205
-
206
-
207
-
208
-
209
-
210
-
211
 |
 |

2010 versus 2009
Operating expenses increased $60 million from 2009 to 2010 primarily due to higher technology and other
expenses related to preparation for higher volumes for the ED Servicing Contract as well as an increase in legal
contingency expenses.
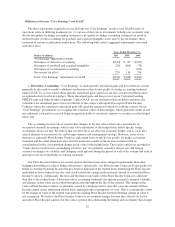
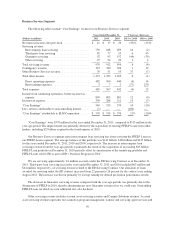
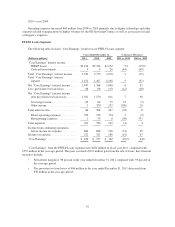
FFELP Loans Segment
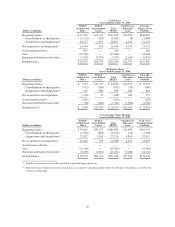
The following table includes “Core Earnings” results for our FFELP Loans segment.
Years Ended December 31, % Increase (Decrease)
(Dollars in millions) 2011 2010 2009 2011 vs. 2010 2010 vs. 2009
“Core Earnings” interest income:
FFELP Loans .................... $2,914 $2,766 $3,252 5% (15)%
Cash and investments .............. 5 9 26 (44) (65)
Total “Core Earnings” interest income . . 2,919 2,775 3,278 5 (15)
Total “Core Earnings” interest
expense ......................... 1,472 1,407 2,238 5 (37)
Net “Core Earnings” interest income .... 1,447 1,368 1,040 6 32
Less: provisions for loan losses ........ 86 98 119 (12) (18)
Net “Core Earnings” interest income
after provisions for loan losses ....... 1,361 1,270 921 7 38
Servicing revenue ................. 85 68 75 25 (9)
Other income .................... 1 320 292 (100) 10
Total other income .................. 86 388 367 (78) 6
Direct operating expenses .......... 760 736 754 3 (2)
Restructuring expenses ............. 1 54 8 (98) 575
Total expenses ..................... 761 790 762 (4) 4
Income from continuing operations,
before income tax expense .......... 686 868 526 (21) 65
Income tax expense ................. 252 311 186 (19) 67
“Core Earnings” .................... $ 434 $ 557 $ 340 (22)% 64%
“Core Earnings” from the FFELP Loans segment were $434 million in fiscal year 2011, compared with
$557 million in the year-ago period. The prior year had a $321 million gain from the sale of loans. Key financial
measures include:
• Net interest margin of .98 percent in the year ended December 31, 2011 compared with .93 percent in
the year-ago period.
• The provision for loan losses of $86 million in the year ended December 31, 2011 decreased from
$98 million in the year-ago period.
52