Sallie Mae 2011 Annual Report Download - page 52
Download and view the complete annual report
Please find page 52 of the 2011 Sallie Mae annual report below. You can navigate through the pages in the report by either clicking on the pages listed below, or by using the keyword search tool below to find specific information within the annual report.-
 1
1 -
2
-
3
-
4
-
5
-
6
-
7
-
8
-
9
-
10
-
11
-
12
-
13
-
14
-
15
-
16
-
17
-
18
-
19
-
20
-
21
-
22
-
23
-
24
-
25
-
26
-
27
-
28
-
29
-
30
-
31
-
32
-
33
-
34
-
35
-
36
-
37
-
38
-
39
-
40
-
41
-
 42
42 -
 43
43 -
 44
44 -
 45
45 -
 46
46 -
 47
47 -
 48
48 -
 49
49 -
 50
50 -
 51
51 -
 52
52 -
 53
53 -
 54
54 -
 55
55 -
 56
56 -
 57
57 -
 58
58 -
 59
59 -
 60
60 -
 61
61 -
 62
62 -
63
-
64
-
65
-
66
-
67
-
68
-
69
-
70
-
71
-
72
-
73
-
74
-
75
-
76
-
77
-
78
-
79
-
80
-
81
-
82
-
83
-
84
-
85
-
86
-
87
-
88
-
89
-
90
-
91
-
92
-
93
-
94
-
95
-
96
-
97
-
98
-
99
-
100
-
101
-
102
-
103
-
104
-
105
-
106
-
107
-
108
-
109
-
110
-
111
-
112
-
113
-
114
-
115
-
116
-
117
-
118
-
119
-
120
-
121
-
122
-
123
-
124
-
125
-
126
-
127
-
128
-
129
-
130
-
131
-
132
-
133
-
134
-
135
-
136
-
137
-
138
-
139
-
140
-
141
-
142
-
143
-
144
-
145
-
146
-
147
-
148
-
149
-
150
-
151
-
152
-
153
-
154
-
155
-
156
-
157
-
158
-
159
-
160
-
161
-
162
-
163
-
164
-
165
-
166
-
167
-
168
-
169
-
170
-
171
-
172
-
173
-
174
-
175
-
176
-
177
-
178
-
179
-
180
-
181
-
182
-
183
-
184
-
185
-
186
-
187
-
188
-
189
-
190
-
191
-
192
-
193
-
194
-
195
-
196
-
197
-
198
-
199
-
200
-
201
-
202
-
203
-
204
-
205
-
206
-
207
-
208
-
209
-
210
-
211
 |
 |

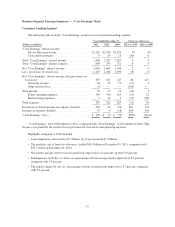
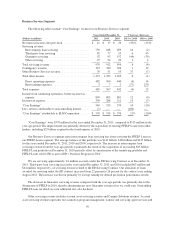
Business Services Segment
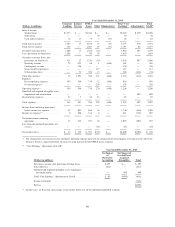
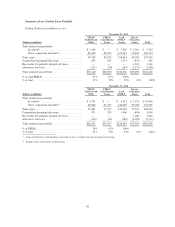
The following tables include “Core Earnings” results for our Business Services segment.
Years Ended December 31, % Increase (Decrease)
(Dollars in millions) 2011 2010 2009 2011 vs. 2010 2010 vs. 2009
Net interest income after provision .................. $ 11 $ 17 $ 20 (35)% (15)%
Servicing revenue:
Intercompany loan servicing ..................... 739 648 659 14 (2)
Third-party loan servicing ....................... 82 77 53 6 45
Guarantor servicing ............................ 52 93 152 (44) (39)
Other servicing ................................ 97 94 90 3 4
Total servicing revenue ........................... 970 912 954 6 (4)
Contingency revenue ............................. 333 330 294 1 12
Other Business Services revenue .................... 70 51 55 37 (7)
Total other income ............................... 1,373 1,293 1,303 6 (1)
Direct operating expenses ....................... 482 500 440 (4) 14
Restructuring expenses ..........................372(57) 250
Total expenses .................................. 485 507 442 (4) 15
Income from continuing operations, before income tax
expense ...................................... 899 803 881 12 (9)
Income tax expense .............................. 330 288 311 15 (7)
“Core Earnings” ................................. 569 515 570 10 (10)
Less: net loss attributable to noncontrolling interest ..... (1) — — (100) —
“Core Earnings” attributable to SLM Corporation ...... $ 570 $ 515 $ 570 11% (10)%
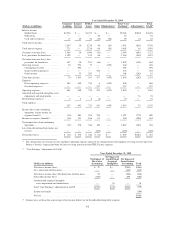
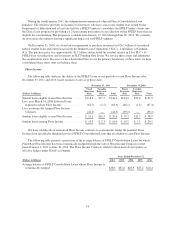
“Core Earnings” were $570 million for the year ended December 31, 2011, compared to $515 million in the
year-ago period. The improvement was primarily driven by the acquisition of existing FFELP Loans from other
lenders, including $25 billion acquired in the fourth quarter of 2010.
Our Business Services segment earns intercompany loan servicing fees from servicing the FFELP Loans in
our FFELP Loans segment. The average balance of this portfolio was $141 billion, $128 billion and $135 billion
for the years ended December 31, 2011, 2010 and 2009, respectively. The increase in intercompany loan
servicing revenue from the year-ago periods is primarily the result of the acquisition of an existing $25 billion
FFELP Loan portfolio on December 31, 2010 partially offset by amortization of the underlying portfolio and
FFELP Loans sold to ED as part of ED’s Purchase Program in 2010.
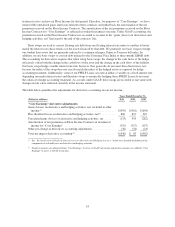
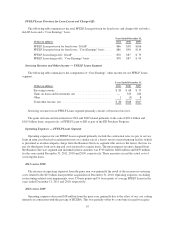
We are servicing approximately 3.6 million accounts under the ED Servicing Contract as of December 31,
2011. Third-party loan servicing fees in the years ended December 31, 2011 and 2010 included $63 million and
$44 million, respectively, of servicing revenue related to the ED Servicing Contract. Our allocation of loans
awarded for servicing under the ED contract increased from 22 percent to 26 percent for the contract year ending
August 2012. The increase was driven primarily by our top ranking for default prevention performance results.
The decrease in Guarantor servicing revenue compared with the year-ago periods was primarily due to the
elimination of FFELP in 2010, thereby eliminating any new Guarantor issuance fees we could earn. Outstanding
FFELP Loans on which we earn additional fees also declined.
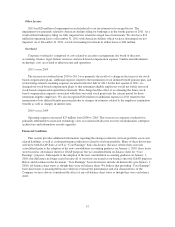
Other servicing revenue includes account asset servicing revenue and Campus Solutions revenue. Account
asset servicing revenue represents fees earned on program management, transfer and servicing agent services and
50