Sallie Mae 2011 Annual Report Download - page 180
Download and view the complete annual report
Please find page 180 of the 2011 Sallie Mae annual report below. You can navigate through the pages in the report by either clicking on the pages listed below, or by using the keyword search tool below to find specific information within the annual report.-
 1
1 -
2
-
3
-
4
-
5
-
6
-
7
-
8
-
9
-
10
-
11
-
12
-
13
-
14
-
15
-
16
-
17
-
18
-
19
-
20
-
21
-
22
-
23
-
24
-
25
-
26
-
27
-
28
-
29
-
30
-
31
-
32
-
33
-
34
-
35
-
36
-
37
-
38
-
39
-
40
-
41
-
42
-
43
-
44
-
45
-
46
-
47
-
48
-
49
-
50
-
51
-
52
-
53
-
54
-
55
-
56
-
57
-
58
-
59
-
60
-
61
-
62
-
63
-
64
-
65
-
66
-
67
-
68
-
69
-
70
-
71
-
72
-
73
-
74
-
75
-
76
-
77
-
78
-
79
-
80
-
81
-
82
-
83
-
84
-
85
-
86
-
87
-
88
-
89
-
90
-
91
-
92
-
93
-
94
-
95
-
96
-
97
-
98
-
99
-
100
-
101
-
102
-
103
-
104
-
105
-
106
-
107
-
108
-
109
-
110
-
111
-
112
-
113
-
114
-
115
-
116
-
117
-
118
-
119
-
120
-
121
-
122
-
123
-
124
-
125
-
126
-
127
-
128
-
129
-
130
-
131
-
132
-
133
-
134
-
135
-
136
-
137
-
138
-
139
-
140
-
141
-
142
-
143
-
144
-
145
-
146
-
147
-
148
-
149
-
150
-
151
-
152
-
153
-
154
-
155
-
156
-
157
-
158
-
159
-
160
-
161
-
162
-
163
-
164
-
165
-
166
-
167
-
168
-
169
-
 170
170 -
 171
171 -
 172
172 -
 173
173 -
 174
174 -
 175
175 -
 176
176 -
 177
177 -
 178
178 -
 179
179 -
 180
180 -
 181
181 -
 182
182 -
 183
183 -
 184
184 -
 185
185 -
 186
186 -
 187
187 -
 188
188 -
 189
189 -
 190
190 -
191
-
192
-
193
-
194
-
195
-
196
-
197
-
198
-
199
-
200
-
201
-
202
-
203
-
204
-
205
-
206
-
207
-
208
-
209
-
210
-
211
 |
 |
SLM CORPORATION
NOTES TO CONSOLIDATED FINANCIAL STATEMENTS (Continued)
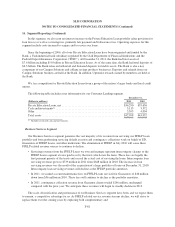
13. Fair Value Measurements (Continued)
amounts change based on changes in the balance of, or pool of assets or debt) hedging trust debt use
internally derived assumptions for the trust assets’ prepayment speeds and default rates to model the
notional amortization. Management makes assumptions concerning the extension features of
derivatives hedging rate-reset notes denominated in a foreign currency. These inputs are not market
observable; therefore, these derivatives are level 3 fair value estimates.
• Floor Income Contracts — Derivatives are valued using an option pricing model. Inputs to the model
include the LIBOR swap yield curve and LIBOR interest rate volatilities. The inputs are observable
inputs in active markets and these derivatives are level 2 fair value estimates.
The carrying value of borrowings designated as the hedged item in a fair value hedge are adjusted for
changes in fair value due to benchmark interest rates and foreign-currency exchange rates. These valuations are
determined through standard bond pricing models and option models (when applicable) using the stated terms of
the borrowings, and observable yield curves, foreign currency exchange rates, and volatilities.
Residual Interests
Prior to the adoption of the new consolidation accounting guidance on January 1, 2010 (see “Note 2 —
Significant Accounting Policies — Consolidation), the Residual Interests were carried at fair value in the
financial statements. No active market exists for student loan Residual Interests; as such, the fair value was
calculated using discounted cash flow models and option models. Observable inputs from active markets were
used where available, including yield curves and volatilities. Significant unobservable inputs such as prepayment
speeds, default rates, certain bonds’ costs of funds and discount rates were used in determining the fair value and
required significant judgment. These unobservable inputs were internally determined based upon analysis of
historical data and expected industry trends. On a quarterly basis we back-tested our prepayment speeds, default
rates and costs of funds assumptions by comparing those assumptions to actual results experienced. We used
non-binding broker quotes and industry analyst reports which show changes in the indicative prices of the asset-
backed securities tranches immediately senior to the Residual Interest as an indication of potential changes in the
discount rate used to value the Residual Interests. Market transactions were not available to validate the models’
results.
F-71