Sallie Mae 2011 Annual Report Download - page 149
Download and view the complete annual report
Please find page 149 of the 2011 Sallie Mae annual report below. You can navigate through the pages in the report by either clicking on the pages listed below, or by using the keyword search tool below to find specific information within the annual report.-
 1
1 -
2
-
3
-
4
-
5
-
6
-
7
-
8
-
9
-
10
-
11
-
12
-
13
-
14
-
15
-
16
-
17
-
18
-
19
-
20
-
21
-
22
-
23
-
24
-
25
-
26
-
27
-
28
-
29
-
30
-
31
-
32
-
33
-
34
-
35
-
36
-
37
-
38
-
39
-
40
-
41
-
42
-
43
-
44
-
45
-
46
-
47
-
48
-
49
-
50
-
51
-
52
-
53
-
54
-
55
-
56
-
57
-
58
-
59
-
60
-
61
-
62
-
63
-
64
-
65
-
66
-
67
-
68
-
69
-
70
-
71
-
72
-
73
-
74
-
75
-
76
-
77
-
78
-
79
-
80
-
81
-
82
-
83
-
84
-
85
-
86
-
87
-
88
-
89
-
90
-
91
-
92
-
93
-
94
-
95
-
96
-
97
-
98
-
99
-
100
-
101
-
102
-
103
-
104
-
105
-
106
-
107
-
108
-
109
-
110
-
111
-
112
-
113
-
114
-
115
-
116
-
117
-
118
-
119
-
120
-
121
-
122
-
123
-
124
-
125
-
126
-
127
-
128
-
129
-
130
-
131
-
132
-
133
-
134
-
135
-
136
-
137
-
138
-
 139
139 -
 140
140 -
 141
141 -
 142
142 -
 143
143 -
 144
144 -
 145
145 -
 146
146 -
 147
147 -
 148
148 -
 149
149 -
 150
150 -
 151
151 -
 152
152 -
 153
153 -
 154
154 -
 155
155 -
 156
156 -
 157
157 -
 158
158 -
 159
159 -
160
-
161
-
162
-
163
-
164
-
165
-
166
-
167
-
168
-
169
-
170
-
171
-
172
-
173
-
174
-
175
-
176
-
177
-
178
-
179
-
180
-
181
-
182
-
183
-
184
-
185
-
186
-
187
-
188
-
189
-
190
-
191
-
192
-
193
-
194
-
195
-
196
-
197
-
198
-
199
-
200
-
201
-
202
-
203
-
204
-
205
-
206
-
207
-
208
-
209
-
210
-
211
 |
 |

SLM CORPORATION
NOTES TO CONSOLIDATED FINANCIAL STATEMENTS (Continued)
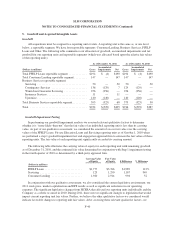
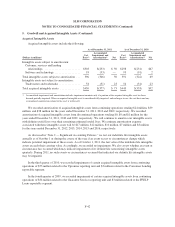
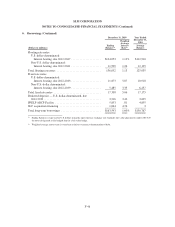
5. Goodwill and Acquired Intangible Assets
Goodwill
All acquisitions must be assigned to a reporting unit or units. A reporting unit is the same as, or one level
below, a reportable segment. We have four reportable segments: Consumer Lending, Business Services, FFELP
Loans and Other. The following table summarizes our allocation of goodwill, accumulated impairments and net
goodwill for our reporting units and reportable segments (which was allocated based upon the relative fair values
of the reporting units).
As of December 31, 2011 As of December 31, 2010
(Dollars in millions) Gross
Accumulated
Impairments Net Gross
Accumulated
Impairments Net
Total FFELP Loans reportable segment ............. $194 $ (4) $190 $194 $ (4) $190
Total Consumer Lending reportable segment ......... 147 — 147 147 — 147
Business Services reportable segment:
Servicing ................................... 50 — 50 50 — 50
Contingency Services ......................... 136 (129) 7 129 (129) —
Wind-down Guarantor Servicing ................ 256 (256) — 256 (256) —
Insurance Services ............................ 11 — 11 — — —
Upromise ................................... 140 (140) — 140 (140) —
Total Business Services reportable segment .......... 593 (525) 68 575 (525) 50
Total ........................................ $934 $(529) $405 $916 $(529) $387
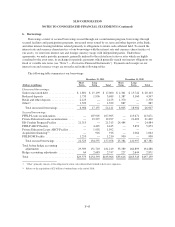
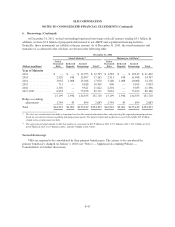
Goodwill Impairment Testing
In performing our goodwill impairment analysis we assessed relevant qualitative factors to determine
whether it is “more-likely-than-not” that the fair value of an individual reporting unit is less than its carrying
value. As part of our qualitative assessment, we considered the amount of excess fair value over the carrying
values of the FFELP Loans, Private Education Loans and Servicing reporting units as of October 1, 2010 when
we performed a step 1 goodwill impairment test and engaged an appraisal firm to estimate the fair values of these
reporting units. The fair value of each reporting unit significantly exceeded its carrying amount.
The following table illustrates the carrying value of equity for each reporting unit with remaining goodwill
as of December 31, 2010, and the estimated fair value determined in conjunction with Step 1 impairment testing
in the fourth quarter of 2010 as determined by a third-party appraisal firm.
Carrying Value
of Equity
Fair Value
of Equity $ Difference % Difference
(Dollars in millions)
FFELP Loans .......................... $1,777 $3,766 $1,989 112%
Servicing ............................. 123 1,290 1,167 949
Consumer Lending ..................... 1,920 2,914 994 52
In conjunction with our qualitative assessment, we also considered the current legislative environment, our
2011 stock price, market capitalization and EPS results as well as significant reductions in our operating
expenses. The significant legislative changes from HCERA that affected our reporting units individually and the
Company as a whole occurred in 2010. During 2011, there were no significant changes to legislation that would
impact current reporting unit fair values. Further, we believe the other qualitative factors we considered would
indicate favorable changes to reporting unit fair values. After assessing these relevant qualitative factors, we
F-40