Sallie Mae 2011 Annual Report Download - page 50
Download and view the complete annual report
Please find page 50 of the 2011 Sallie Mae annual report below. You can navigate through the pages in the report by either clicking on the pages listed below, or by using the keyword search tool below to find specific information within the annual report.-
 1
1 -
2
-
3
-
4
-
5
-
6
-
7
-
8
-
9
-
10
-
11
-
12
-
13
-
14
-
15
-
16
-
17
-
18
-
19
-
20
-
21
-
22
-
23
-
24
-
25
-
26
-
27
-
28
-
29
-
30
-
31
-
32
-
33
-
34
-
35
-
36
-
37
-
38
-
39
-
 40
40 -
 41
41 -
 42
42 -
 43
43 -
 44
44 -
 45
45 -
 46
46 -
 47
47 -
 48
48 -
 49
49 -
 50
50 -
 51
51 -
 52
52 -
 53
53 -
 54
54 -
 55
55 -
 56
56 -
 57
57 -
 58
58 -
 59
59 -
 60
60 -
61
-
62
-
63
-
64
-
65
-
66
-
67
-
68
-
69
-
70
-
71
-
72
-
73
-
74
-
75
-
76
-
77
-
78
-
79
-
80
-
81
-
82
-
83
-
84
-
85
-
86
-
87
-
88
-
89
-
90
-
91
-
92
-
93
-
94
-
95
-
96
-
97
-
98
-
99
-
100
-
101
-
102
-
103
-
104
-
105
-
106
-
107
-
108
-
109
-
110
-
111
-
112
-
113
-
114
-
115
-
116
-
117
-
118
-
119
-
120
-
121
-
122
-
123
-
124
-
125
-
126
-
127
-
128
-
129
-
130
-
131
-
132
-
133
-
134
-
135
-
136
-
137
-
138
-
139
-
140
-
141
-
142
-
143
-
144
-
145
-
146
-
147
-
148
-
149
-
150
-
151
-
152
-
153
-
154
-
155
-
156
-
157
-
158
-
159
-
160
-
161
-
162
-
163
-
164
-
165
-
166
-
167
-
168
-
169
-
170
-
171
-
172
-
173
-
174
-
175
-
176
-
177
-
178
-
179
-
180
-
181
-
182
-
183
-
184
-
185
-
186
-
187
-
188
-
189
-
190
-
191
-
192
-
193
-
194
-
195
-
196
-
197
-
198
-
199
-
200
-
201
-
202
-
203
-
204
-
205
-
206
-
207
-
208
-
209
-
210
-
211
 |
 |

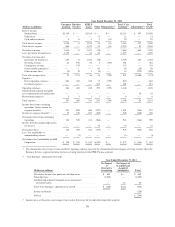
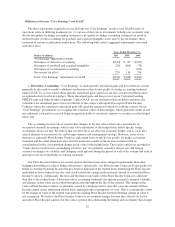
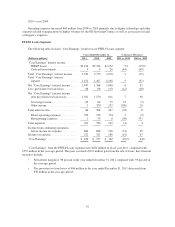
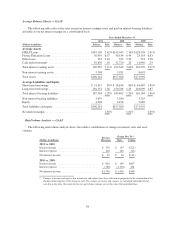
Consumer Lending Net Interest Margin
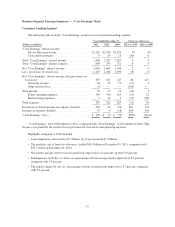
The following table shows the Consumer Lending “Core Earnings” net interest margin along with
reconciliation to the GAAP-basis Consumer Lending net interest margin before provision for loan losses.
Years Ended December 31,
2011 2010 2009
“Core Earnings” basis Private Education student loan yield .............. 6.34% 6.15% 5.99%
Discount amortization ........................................... .23 .29 .26
“Core Earnings” basis Private Education Loan net yield ................. 6.57 6.44 6.25
“Core Earnings” basis Private Education Loan cost of funds ............. (1.99) (1.79) (1.78)
“Core Earnings” basis Private Education Loan spread .................. 4.58 4.65 4.47
“Core Earnings” basis other asset spread impact ....................... (.49) (.80) (.62)
“Core Earnings” basis Consumer Lending net interest margin(1) .......... 4.09% 3.85% 3.85%
“Core Earnings” basis Consumer Lending net interest margin(1) .......... 4.09% 3.85% 3.85%
Adjustment for GAAP accounting treatment .......................... (.08) .02 (.16)
GAAP-basis Consumer Lending net interest margin(1) .................. 4.01% 3.87% 3.69%
(1) The average balances of our Consumer Lending “Core Earnings” basis interest-earning assets for the respective periods are:
(Dollars in millions)
Private Education Loans .................................................... $36,955 $36,534 $36,046
Other interest-earning assets ................................................. 3,015 5,204 4,072
Total Consumer Lending “Core Earnings” basis interest-earning assets ............... $39,970 $41,738 $40,118
The increase in the “Core Earnings” basis Consumer Lending net interest margin for 2011 over the prior
year was primarily due to the decline in the average balance of our other asset portfolio. The size of the other
asset portfolio, which is primarily securitization trust restricted cash and cash held at the Bank, has decreased
significantly. This other asset portfolio earns a negative yield and as a result, when its relative weighting
decreases compared to the Private Education Loan portfolio, the overall net interest margin increases.
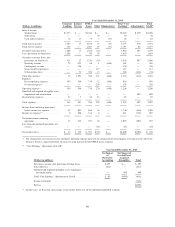
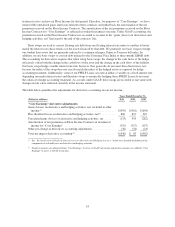
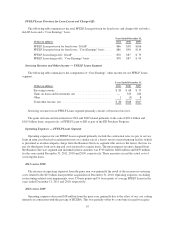
Private Education Loans Provision for Loan Losses and Charge-Offs
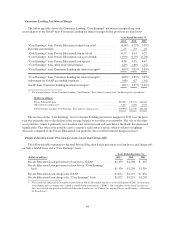
The following table summarizes the total Private Education Loans provisions for loan losses and charge-offs
on both a GAAP-basis and a “Core Earnings” basis.
Years Ended December 31,
(Dollars in millions) 2011(1) 2010 2009
Private Education Loan provision for loan losses, GAAP ............ $1,179 $1,298 $ 967
Private Education Loan provision for loan losses, “Core Earnings”
basis ................................................... $1,179 $1,298 $1,399
Private Education Loan charge-offs, GAAP ...................... $1,072 $1,291 $ 876
Private Education Loan charge-offs, “Core Earnings” basis .......... $1,072 $1,291 $1,299
(1) We recorded an additional $124 million of provision for Private Education Loan losses in the third quarter of 2011 in connection
with adopting new accounting rules related to troubled debt restructurings (“TDRs”). For a complete discussion of the effect of
these new rules on our provision for Private Education Loan losses, see “Critical Accounting Policies and Estimates —Allowance
for Loan Losses”.
48