Sallie Mae 2011 Annual Report Download - page 37
Download and view the complete annual report
Please find page 37 of the 2011 Sallie Mae annual report below. You can navigate through the pages in the report by either clicking on the pages listed below, or by using the keyword search tool below to find specific information within the annual report.-
 1
1 -
2
-
3
-
4
-
5
-
6
-
7
-
8
-
9
-
10
-
11
-
12
-
13
-
14
-
15
-
16
-
17
-
18
-
19
-
20
-
21
-
22
-
23
-
24
-
25
-
26
-
 27
27 -
 28
28 -
 29
29 -
 30
30 -
 31
31 -
 32
32 -
 33
33 -
 34
34 -
 35
35 -
 36
36 -
 37
37 -
 38
38 -
 39
39 -
 40
40 -
 41
41 -
 42
42 -
 43
43 -
 44
44 -
 45
45 -
 46
46 -
 47
47 -
48
-
49
-
50
-
51
-
52
-
53
-
54
-
55
-
56
-
57
-
58
-
59
-
60
-
61
-
62
-
63
-
64
-
65
-
66
-
67
-
68
-
69
-
70
-
71
-
72
-
73
-
74
-
75
-
76
-
77
-
78
-
79
-
80
-
81
-
82
-
83
-
84
-
85
-
86
-
87
-
88
-
89
-
90
-
91
-
92
-
93
-
94
-
95
-
96
-
97
-
98
-
99
-
100
-
101
-
102
-
103
-
104
-
105
-
106
-
107
-
108
-
109
-
110
-
111
-
112
-
113
-
114
-
115
-
116
-
117
-
118
-
119
-
120
-
121
-
122
-
123
-
124
-
125
-
126
-
127
-
128
-
129
-
130
-
131
-
132
-
133
-
134
-
135
-
136
-
137
-
138
-
139
-
140
-
141
-
142
-
143
-
144
-
145
-
146
-
147
-
148
-
149
-
150
-
151
-
152
-
153
-
154
-
155
-
156
-
157
-
158
-
159
-
160
-
161
-
162
-
163
-
164
-
165
-
166
-
167
-
168
-
169
-
170
-
171
-
172
-
173
-
174
-
175
-
176
-
177
-
178
-
179
-
180
-
181
-
182
-
183
-
184
-
185
-
186
-
187
-
188
-
189
-
190
-
191
-
192
-
193
-
194
-
195
-
196
-
197
-
198
-
199
-
200
-
201
-
202
-
203
-
204
-
205
-
206
-
207
-
208
-
209
-
210
-
211
 |
 |
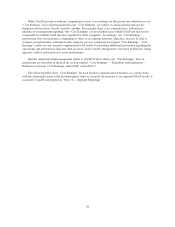
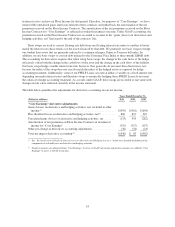
• Goodwill and acquired intangible assets impairment and amortization expense declined $675 million
compared with the prior year primarily due to the $660 million impairment recognized in the third quarter
of 2010 in response to the passage of the Health Care and Education Reconciliation Act of 2010
(“HCERA”), which resulted in the elimination of the FFELP and significantly reduced the future earnings
for several of our reporting units.
• Restructuring expenses decreased $76 million primarily as a result of the substantial completion of our
plan for restructuring initiated in response to legislation ending FFELP in 2010.
• The effective tax rates for the years ended December 31, 2011 and 2010 were 35 percent and 45 percent,
respectively. The improvement in the effective tax rate was primarily driven by the impact of non-tax
deductible goodwill impairments recorded in 2010.
• Net income from discontinued operations for the year ended December 31, 2011 was $33 million
compared with a net loss from discontinued operations of $67 million for the year ended December 31,
2010. The change was primarily driven by a $23 million after-tax gain realized from the sale of our
Purchased Paper — Non-Mortgage portfolio in the third quarter of 2011 compared to $52 million of
after-tax impairments recognized in 2010.
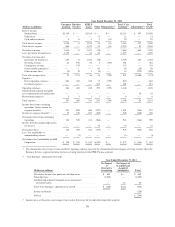
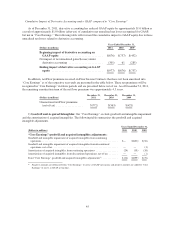
Year Ended December 31, 2010 Compared with Year Ended December 31, 2009
For the years ended December 31, 2010 and 2009, net income was $530 million, or $.94 diluted earnings
per common share, and $324 million, or $.38 diluted earnings per common share, respectively. The increase in
net income for the year ended December 31, 2010, compared with the prior year was primarily due to a
$1.5 billion increase in net interest income after provisions for loan losses and a $243 million decrease in net
losses on derivative and hedging activities. These improvements were partially offset by a $660 million goodwill
and intangible asset impairment charge in 2010, a $165 million increase in operating expenses, a $219 million
decrease in gains on debt repurchases and a decrease in securitization servicing and Residual Interest revenue of
$295 million.
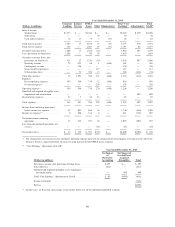
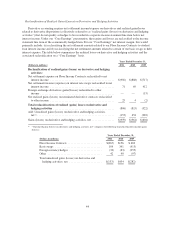
The primary contributors to each of the identified drivers of changes in income from continuing operations
before income tax expense for the year-over-year period are as follows:
• Net interest income after provisions for loan losses increased by $1.5 billion in the year ended
December 31, 2010 from the year ended December 31, 2009. The increase in net interest income and
provisions for loan losses was partially due to the adoption as of January 1, 2010 of the new consolidation
accounting guidance which resulted in the consolidation of $35.0 billion of assets and $34.4 billion of
liabilities in certain securitizations trusts. (See “Note 2 — Significant Accounting Policies” for a further
discussion of the effect of adopting the new consolidation accounting guidance). The consolidation of
these securitization trusts as of January 1, 2010 resulted in $998 million of additional net interest income
and $355 million of additional provisions for loan losses for the year ended December 31, 2010.
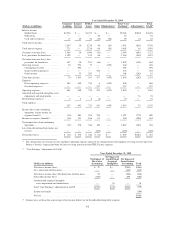
Excluding the effect of the trusts being consolidated as of January 1, 2010, net interest income increased
$758 million from the year ended 2009 and provisions for loan losses decreased $55 million from the year
ended 2009. The increase in net interest income, excluding the effect of the new consolidation accounting
guidance, was primarily the result of an increase in the FFELP Loans net interest margin primarily due to
an improvement in our funding costs, a 24 basis point tightening of the CP/LIBOR spread and the effect
of not receiving hedge accounting treatment for derivatives used to economically hedge risk affecting net
interest income. The decrease in the provisions for loan losses relates to the Private Education Loan loss
provision, which decreased as a result of the improving performance of the portfolio.
• Securitization servicing and Residual Interest revenue was no longer recorded in fiscal year 2010 due to
the adoption of the new consolidation accounting guidance; however, we recognized $295 million in the
prior year.
35