Sallie Mae 2011 Annual Report Download - page 49
Download and view the complete annual report
Please find page 49 of the 2011 Sallie Mae annual report below. You can navigate through the pages in the report by either clicking on the pages listed below, or by using the keyword search tool below to find specific information within the annual report.-
 1
1 -
2
-
3
-
4
-
5
-
6
-
7
-
8
-
9
-
10
-
11
-
12
-
13
-
14
-
15
-
16
-
17
-
18
-
19
-
20
-
21
-
22
-
23
-
24
-
25
-
26
-
27
-
28
-
29
-
30
-
31
-
32
-
33
-
34
-
35
-
36
-
37
-
38
-
 39
39 -
 40
40 -
 41
41 -
 42
42 -
 43
43 -
 44
44 -
 45
45 -
 46
46 -
 47
47 -
 48
48 -
 49
49 -
 50
50 -
 51
51 -
 52
52 -
 53
53 -
 54
54 -
 55
55 -
 56
56 -
 57
57 -
 58
58 -
 59
59 -
60
-
61
-
62
-
63
-
64
-
65
-
66
-
67
-
68
-
69
-
70
-
71
-
72
-
73
-
74
-
75
-
76
-
77
-
78
-
79
-
80
-
81
-
82
-
83
-
84
-
85
-
86
-
87
-
88
-
89
-
90
-
91
-
92
-
93
-
94
-
95
-
96
-
97
-
98
-
99
-
100
-
101
-
102
-
103
-
104
-
105
-
106
-
107
-
108
-
109
-
110
-
111
-
112
-
113
-
114
-
115
-
116
-
117
-
118
-
119
-
120
-
121
-
122
-
123
-
124
-
125
-
126
-
127
-
128
-
129
-
130
-
131
-
132
-
133
-
134
-
135
-
136
-
137
-
138
-
139
-
140
-
141
-
142
-
143
-
144
-
145
-
146
-
147
-
148
-
149
-
150
-
151
-
152
-
153
-
154
-
155
-
156
-
157
-
158
-
159
-
160
-
161
-
162
-
163
-
164
-
165
-
166
-
167
-
168
-
169
-
170
-
171
-
172
-
173
-
174
-
175
-
176
-
177
-
178
-
179
-
180
-
181
-
182
-
183
-
184
-
185
-
186
-
187
-
188
-
189
-
190
-
191
-
192
-
193
-
194
-
195
-
196
-
197
-
198
-
199
-
200
-
201
-
202
-
203
-
204
-
205
-
206
-
207
-
208
-
209
-
210
-
211
 |
 |

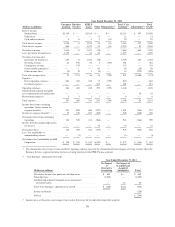
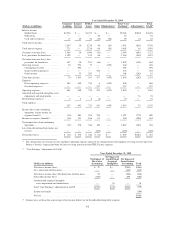
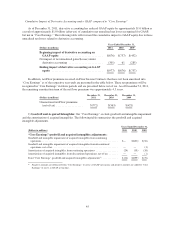
Business Segment Earnings Summary — “Core Earnings” Basis
Consumer Lending Segment
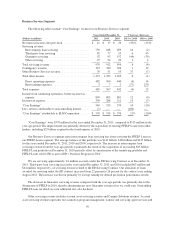
The following table includes “Core Earnings” results for our Consumer Lending segment.
Years Ended December 31, % Increase (Decrease)
(Dollars in millions) 2011 2010 2009 2011 vs. 2010 2010 vs. 2009
“Core Earnings” interest income:
Private Education Loans ...................... $2,429 $2,353 $2,254 3% 4%
Cash and investments ......................... 9 14 13 (36) 8
Total “Core Earnings” interest income ............... 2,438 2,367 2,267 3 4
Total “Core Earnings” interest expense ............... 804 758 721 6 5
Net “Core Earnings” interest income ................. 1,634 1,609 1,546 2 4
Less: provisions for loan losses ..................... 1,179 1,298 1,399 (9) (7)
Net “Core Earnings” interest income after provisions for
loan losses ................................... 455 311 147 46 112
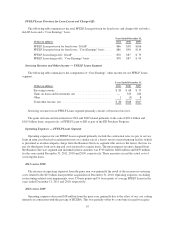
Servicing revenue ............................ 64 72 70 (11) 3
Other income (loss) .......................... (9) — — (100) —
Total income .................................... 55 72 70 (24) 3
Direct operating expenses ..................... 304 350 265 (13) 32
Restructuring expenses ........................ 3 12 2 (75) 500
Total expenses .................................. 307 362 267 (15) 36
Income (loss) before income tax expense (benefit) ...... 203 21 (50) 867 142
Income tax expense (benefit) ....................... 75 8 (18) 838 144
“Core Earnings” (loss) ............................ $ 128 $ 13 $ (32) 885% (141)%
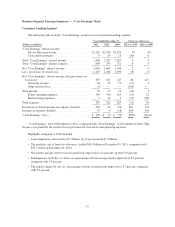
“Core Earnings” were $128 million in 2011, compared with “Core Earnings” of $13 million in 2010. This
increase was primarily the result of lower provision for loan losses and operating expenses.
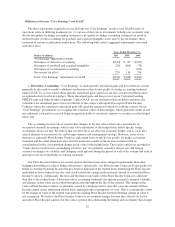
Highlights compared to 2010 included:
• Loan originations increased to $2.7 billion, up 19 percent from $2.3 billion.
• The portfolio, net of loan loss allowance, totaled $36.3 billion at December 31, 2011, compared with
$35.7 billion at December 31, 2010.
• Net interest margin, before loan loss provision, improved to 4.1 percent, up from 3.9 percent.
• Delinquencies of 90 days or more (as a percentage of loans in repayment) improved to 4.9 percent,
compared with 5.3 percent.
• The annual charge-off rate (as a percentage of loans in repayment) improved to 3.7 percent, compared
with 5.0 percent.
47