Sallie Mae 2011 Annual Report Download - page 173
Download and view the complete annual report
Please find page 173 of the 2011 Sallie Mae annual report below. You can navigate through the pages in the report by either clicking on the pages listed below, or by using the keyword search tool below to find specific information within the annual report.-
 1
1 -
2
-
3
-
4
-
5
-
6
-
7
-
8
-
9
-
10
-
11
-
12
-
13
-
14
-
15
-
16
-
17
-
18
-
19
-
20
-
21
-
22
-
23
-
24
-
25
-
26
-
27
-
28
-
29
-
30
-
31
-
32
-
33
-
34
-
35
-
36
-
37
-
38
-
39
-
40
-
41
-
42
-
43
-
44
-
45
-
46
-
47
-
48
-
49
-
50
-
51
-
52
-
53
-
54
-
55
-
56
-
57
-
58
-
59
-
60
-
61
-
62
-
63
-
64
-
65
-
66
-
67
-
68
-
69
-
70
-
71
-
72
-
73
-
74
-
75
-
76
-
77
-
78
-
79
-
80
-
81
-
82
-
83
-
84
-
85
-
86
-
87
-
88
-
89
-
90
-
91
-
92
-
93
-
94
-
95
-
96
-
97
-
98
-
99
-
100
-
101
-
102
-
103
-
104
-
105
-
106
-
107
-
108
-
109
-
110
-
111
-
112
-
113
-
114
-
115
-
116
-
117
-
118
-
119
-
120
-
121
-
122
-
123
-
124
-
125
-
126
-
127
-
128
-
129
-
130
-
131
-
132
-
133
-
134
-
135
-
136
-
137
-
138
-
139
-
140
-
141
-
142
-
143
-
144
-
145
-
146
-
147
-
148
-
149
-
150
-
151
-
152
-
153
-
154
-
155
-
156
-
157
-
158
-
159
-
160
-
161
-
162
-
 163
163 -
 164
164 -
 165
165 -
 166
166 -
 167
167 -
 168
168 -
 169
169 -
 170
170 -
 171
171 -
 172
172 -
 173
173 -
 174
174 -
 175
175 -
 176
176 -
 177
177 -
 178
178 -
 179
179 -
 180
180 -
 181
181 -
 182
182 -
 183
183 -
184
-
185
-
186
-
187
-
188
-
189
-
190
-
191
-
192
-
193
-
194
-
195
-
196
-
197
-
198
-
199
-
200
-
201
-
202
-
203
-
204
-
205
-
206
-
207
-
208
-
209
-
210
-
211
 |
 |

SLM CORPORATION
NOTES TO CONSOLIDATED FINANCIAL STATEMENTS (Continued)
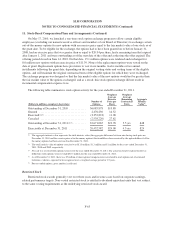
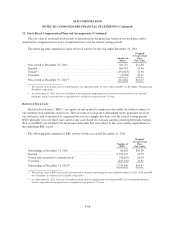
11. Stock-Based Compensation Plans and Arrangements (Continued)
From January 1, 2007 through May 21, 2009, we granted stock options and restricted stock to our
employees and non-employee directors under the SLM Corporation Incentive Plan and the Directors Stock Plan.
The total stock-based compensation cost recognized in the consolidated statements of income for the years
ended December 31, 2011, 2010 and 2009 was $56 million, $40 million and $51 million, respectively. As of
December 31, 2011, there was $18 million of total unrecognized compensation cost related to unvested stock
awards net of estimated forfeitures, which is expected to be recognized over a weighted average period of 1.9
years.
In the first quarter of 2011, we changed our stock-based compensation plans so that retirement eligible
employees would not forfeit unvested stock-based compensation upon their retirement. This change had the
effect of accelerating $11 million of future stock-based compensation expenses associated with these unvested
stock grants into the first quarter of 2011 for those employees who are retirement eligible or who will become
retirement eligible prior to the vesting date.
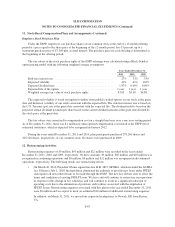
Stock Options
The maximum term for stock options is 10 years and the exercise price must be equal to or greater than the
market price of our common stock on the grant date. We have granted time-vested, price-vested and
performance-vested options to our employees and non-employee directors. Time-vested options granted to
management and non-management employees generally vest over three years. Price-vested options granted to
management employees vest upon our common stock reaching a targeted closing price for a set number of days.
Performance-vested options granted to management employees vest one-third per year for three years based on
corporate earnings-related performance targets. Options granted to non-employee directors in 2009 and prior
years vest upon our common stock price reaching a targeted closing price for a set number of days and options
granted after 2009 vest upon the director’s election to the Board.
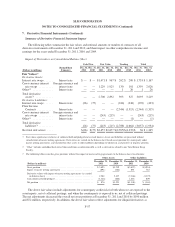
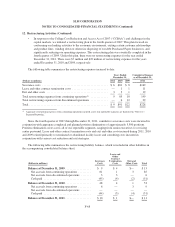
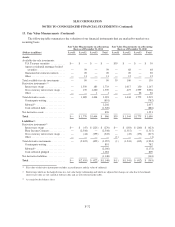
The fair values of the options granted in the years ended December 31, 2011, 2010 and 2009 were estimated
as of the grant date using a Black-Scholes option pricing model with the following weighted average
assumptions:
Years Ended December 31,
2011 2010 2009
Risk-free interest rate ................................... 1.57% 1.60% 1.51%
Expected volatility ..................................... 54% 60% 80%
Expected dividend rate .................................. 2.58% 0.00% 0.00%
Expected life of the option ............................... 4.1years 3.3 years 3.5 years
Weighted average fair value of options granted .............. $5.18 $4.40 $5.82
The expected life of the options is based on observed historical exercise patterns. Groups of employees (and
non-employee directors) that have received similar option grant terms are considered separately for valuation
purposes. The expected volatility is based on implied volatility from publicly-traded options on our stock at the
grant date and historical volatility of our stock consistent with the expected life of the option. The risk-free
interest rate is based on the U.S. Treasury spot rate at the grant date consistent with the expected life of the
option. The dividend yield is based on the projected annual dividend payment per share based on the dividend
amount at the grant date, divided by the stock price at the grant date.
F-64