Sallie Mae 2011 Annual Report Download - page 58
Download and view the complete annual report
Please find page 58 of the 2011 Sallie Mae annual report below. You can navigate through the pages in the report by either clicking on the pages listed below, or by using the keyword search tool below to find specific information within the annual report.-
 1
1 -
2
-
3
-
4
-
5
-
6
-
7
-
8
-
9
-
10
-
11
-
12
-
13
-
14
-
15
-
16
-
17
-
18
-
19
-
20
-
21
-
22
-
23
-
24
-
25
-
26
-
27
-
28
-
29
-
30
-
31
-
32
-
33
-
34
-
35
-
36
-
37
-
38
-
39
-
40
-
41
-
42
-
43
-
44
-
45
-
46
-
47
-
 48
48 -
 49
49 -
 50
50 -
 51
51 -
 52
52 -
 53
53 -
 54
54 -
 55
55 -
 56
56 -
 57
57 -
 58
58 -
 59
59 -
 60
60 -
 61
61 -
 62
62 -
 63
63 -
 64
64 -
 65
65 -
 66
66 -
 67
67 -
 68
68 -
69
-
70
-
71
-
72
-
73
-
74
-
75
-
76
-
77
-
78
-
79
-
80
-
81
-
82
-
83
-
84
-
85
-
86
-
87
-
88
-
89
-
90
-
91
-
92
-
93
-
94
-
95
-
96
-
97
-
98
-
99
-
100
-
101
-
102
-
103
-
104
-
105
-
106
-
107
-
108
-
109
-
110
-
111
-
112
-
113
-
114
-
115
-
116
-
117
-
118
-
119
-
120
-
121
-
122
-
123
-
124
-
125
-
126
-
127
-
128
-
129
-
130
-
131
-
132
-
133
-
134
-
135
-
136
-
137
-
138
-
139
-
140
-
141
-
142
-
143
-
144
-
145
-
146
-
147
-
148
-
149
-
150
-
151
-
152
-
153
-
154
-
155
-
156
-
157
-
158
-
159
-
160
-
161
-
162
-
163
-
164
-
165
-
166
-
167
-
168
-
169
-
170
-
171
-
172
-
173
-
174
-
175
-
176
-
177
-
178
-
179
-
180
-
181
-
182
-
183
-
184
-
185
-
186
-
187
-
188
-
189
-
190
-
191
-
192
-
193
-
194
-
195
-
196
-
197
-
198
-
199
-
200
-
201
-
202
-
203
-
204
-
205
-
206
-
207
-
208
-
209
-
210
-
211
 |
 |

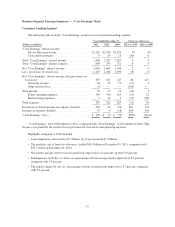
the SLC portfolio, an increase in legal contingency expenses and costs related to closing and selling two loan
originations centers in 2010. Operating expenses, excluding restructuring-related asset impairments, were
51 basis points and 50 basis points of average “Core Earnings” basis FFELP Loans in the years ended
December 31, 2010 and 2009, respectively.
Other Segment
The Other segment primarily consists of the financial results related to the repurchase of debt, the corporate
liquidity portfolio and all overhead. We also include results from smaller wind-down and discontinued operations
within this segment. These are the Purchased Paper businesses and mortgage and other loan businesses. The
Other segment includes our remaining businesses that do not pertain directly to the primary segments identified
above. Overhead expenses include costs related to executive management, the board of directors, accounting,
finance, legal, human resources, stock-based compensation expense and certain information technology costs
related to infrastructure and operations.
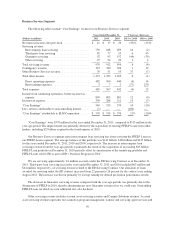
The following table includes “Core Earnings” results for our Other segment.
Years Ended
December 31, % Increase (Decrease)
(Dollars in millions) 2011 2010 2009 2011 vs. 2010 2010 vs. 2009
Net interest loss after provision ........................ $ (58) $ (35) $ (66) 66% (47)%
Gains on debt repurchases ........................ 64 317 536 (80) (41)
Other ......................................... (8) 14 1 (157) 1,300
Total income ....................................... 56 331 537 (83) (38)
Direct operating expenses ............................. 13 12 6 8 100
Overhead expenses:
Corporate overhead ............................. 163 128 138 27 (7)
Unallocated information technology costs ............ 117 130 99 (10) 31
Total overhead expenses .............................. 280 258 237 9 9
Total operating expenses ............................. 293 270 243 9 11
Restructuring expenses ............................... 2 12 (2) (83) 700
Total expenses ..................................... 295 282 241 5 17
Income (loss) from continuing operations, before income tax
expense (benefit) ................................. (297) 14 230 (2,221) (94)
Income tax expense (benefit) .......................... (109) 4 81 (2,825) (95)
Net income (loss) from continuing operations ............. (188) 10 149 (1,980) (93)
Income (loss) from discontinued operations, net of tax ...... 33 (67) (220) 149 (70)
“Core Earnings” net loss ............................. $(155) $ (57) $ (71) 172% (20)%
Purchased Paper Business
Our Purchased Paper businesses are presented as discontinued operations for the current and prior periods
(see “Consolidated Earnings Summary — GAAP-basis” for a further discussion). We sold our Purchased
Paper — Non-Mortgage business, resulting in a $23 million after-tax gain, in the third quarter of 2011.
Gains on Debt Repurchases
We began repurchasing our outstanding debt in the second quarter of 2008. We repurchased $894 million,
$4.9 billion and $3.4 billion face amount of our senior unsecured notes in 2011, 2010 and 2009, respectively.
Since the second quarter of 2008, we repurchased $11.1 billion face amount of our senior unsecured notes in the
aggregate, with maturity dates ranging from 2008 to 2016.
56