Sallie Mae 2011 Annual Report Download - page 175
Download and view the complete annual report
Please find page 175 of the 2011 Sallie Mae annual report below. You can navigate through the pages in the report by either clicking on the pages listed below, or by using the keyword search tool below to find specific information within the annual report.-
 1
1 -
2
-
3
-
4
-
5
-
6
-
7
-
8
-
9
-
10
-
11
-
12
-
13
-
14
-
15
-
16
-
17
-
18
-
19
-
20
-
21
-
22
-
23
-
24
-
25
-
26
-
27
-
28
-
29
-
30
-
31
-
32
-
33
-
34
-
35
-
36
-
37
-
38
-
39
-
40
-
41
-
42
-
43
-
44
-
45
-
46
-
47
-
48
-
49
-
50
-
51
-
52
-
53
-
54
-
55
-
56
-
57
-
58
-
59
-
60
-
61
-
62
-
63
-
64
-
65
-
66
-
67
-
68
-
69
-
70
-
71
-
72
-
73
-
74
-
75
-
76
-
77
-
78
-
79
-
80
-
81
-
82
-
83
-
84
-
85
-
86
-
87
-
88
-
89
-
90
-
91
-
92
-
93
-
94
-
95
-
96
-
97
-
98
-
99
-
100
-
101
-
102
-
103
-
104
-
105
-
106
-
107
-
108
-
109
-
110
-
111
-
112
-
113
-
114
-
115
-
116
-
117
-
118
-
119
-
120
-
121
-
122
-
123
-
124
-
125
-
126
-
127
-
128
-
129
-
130
-
131
-
132
-
133
-
134
-
135
-
136
-
137
-
138
-
139
-
140
-
141
-
142
-
143
-
144
-
145
-
146
-
147
-
148
-
149
-
150
-
151
-
152
-
153
-
154
-
155
-
156
-
157
-
158
-
159
-
160
-
161
-
162
-
163
-
164
-
 165
165 -
 166
166 -
 167
167 -
 168
168 -
 169
169 -
 170
170 -
 171
171 -
 172
172 -
 173
173 -
 174
174 -
 175
175 -
 176
176 -
 177
177 -
 178
178 -
 179
179 -
 180
180 -
 181
181 -
 182
182 -
 183
183 -
 184
184 -
 185
185 -
186
-
187
-
188
-
189
-
190
-
191
-
192
-
193
-
194
-
195
-
196
-
197
-
198
-
199
-
200
-
201
-
202
-
203
-
204
-
205
-
206
-
207
-
208
-
209
-
210
-
211
 |
 |

SLM CORPORATION
NOTES TO CONSOLIDATED FINANCIAL STATEMENTS (Continued)
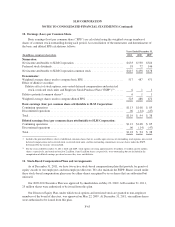
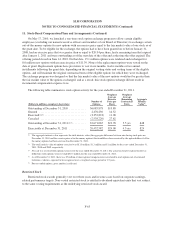
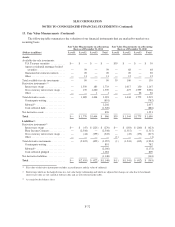
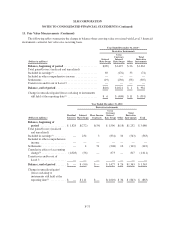
11. Stock-Based Compensation Plans and Arrangements (Continued)
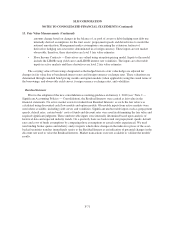
The fair value of restricted stock awards is determined on the grant date based on our stock price and is
amortized to compensation cost on a straight-line basis over the related vesting periods.
The following table summarizes restricted stock activity for the year ended December 31, 2011.
Number of
Shares
Weighted
Average Grant
Date
Fair Value
Non-vested at December 31, 2010 ................................ 701,737 $11.98
Granted ..................................................... 166,750 13.56
Vested(1) .................................................... (451,625) 12.98
Canceled .................................................... (4,000) 10.31
Non-vested at December 31, 2011(2) .............................. 412,862 $12.07
(1) The total fair value of shares that vested during the years ended December 31, 2011, 2010 and 2009, was $6 million, $9 million and
$9 million, respectively.
(2) As of December 31, 2011, there was $1 million of unrecognized compensation cost related to restricted stock net of estimated
forfeitures, which is expected to be recognized over a weighted average period of 1.4 years.
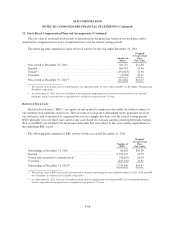
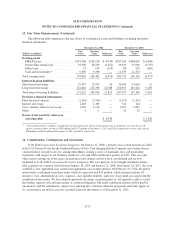
Restricted Stock Units
Restricted stock units (“RSUs”) are equity awards granted to employees that entitle the holder to shares of
our common stock when the award vests. The fair value of each grant is determined on the grant date based on
our stock price and is amortized to compensation cost on a straight-line basis over the related vesting periods.
RSUs generally vest over three years and in some cases based on corporate earnings-related performance targets.
Non-vested RSUs are entitled to dividend equivalent units that vest subject to the same vesting requirements as
the underlying RSU award.
The following table summarizes RSU activity for the year ended December 31, 2011.
Number of
RSUs
Weighted
Average Grant
Date
Fair Value
Outstanding at December 31, 2010 .............................. 96,681 $10.50
Granted .................................................... 2,779,075 14.75
Vested and converted to common stock(1) ......................... (41,625) 10.45
Canceled ................................................... (103,441) 14.61
Outstanding at December 31, 2011(2) ............................. 2,730,690 $14.67
(1) The total fair value of RSUs that vested and converted to common stock during the years ended December 31, 2011, 2010 and 2009
was $.4 million, $.4 million and $.1 million, respectively.
(2) As of December 31, 2011, there was $11 million of unrecognized compensation cost related to RSUs net of estimated forfeitures,
which is expected to be recognized over a weighted average period of 2.2 years.
F-66