Sallie Mae 2011 Annual Report Download - page 202
Download and view the complete annual report
Please find page 202 of the 2011 Sallie Mae annual report below. You can navigate through the pages in the report by either clicking on the pages listed below, or by using the keyword search tool below to find specific information within the annual report.-
 1
1 -
2
-
3
-
4
-
5
-
6
-
7
-
8
-
9
-
10
-
11
-
12
-
13
-
14
-
15
-
16
-
17
-
18
-
19
-
20
-
21
-
22
-
23
-
24
-
25
-
26
-
27
-
28
-
29
-
30
-
31
-
32
-
33
-
34
-
35
-
36
-
37
-
38
-
39
-
40
-
41
-
42
-
43
-
44
-
45
-
46
-
47
-
48
-
49
-
50
-
51
-
52
-
53
-
54
-
55
-
56
-
57
-
58
-
59
-
60
-
61
-
62
-
63
-
64
-
65
-
66
-
67
-
68
-
69
-
70
-
71
-
72
-
73
-
74
-
75
-
76
-
77
-
78
-
79
-
80
-
81
-
82
-
83
-
84
-
85
-
86
-
87
-
88
-
89
-
90
-
91
-
92
-
93
-
94
-
95
-
96
-
97
-
98
-
99
-
100
-
101
-
102
-
103
-
104
-
105
-
106
-
107
-
108
-
109
-
110
-
111
-
112
-
113
-
114
-
115
-
116
-
117
-
118
-
119
-
120
-
121
-
122
-
123
-
124
-
125
-
126
-
127
-
128
-
129
-
130
-
131
-
132
-
133
-
134
-
135
-
136
-
137
-
138
-
139
-
140
-
141
-
142
-
143
-
144
-
145
-
146
-
147
-
148
-
149
-
150
-
151
-
152
-
153
-
154
-
155
-
156
-
157
-
158
-
159
-
160
-
161
-
162
-
163
-
164
-
165
-
166
-
167
-
168
-
169
-
170
-
171
-
172
-
173
-
174
-
175
-
176
-
177
-
178
-
179
-
180
-
181
-
182
-
183
-
184
-
185
-
186
-
187
-
188
-
189
-
190
-
191
-
 192
192 -
 193
193 -
 194
194 -
 195
195 -
 196
196 -
 197
197 -
 198
198 -
 199
199 -
 200
200 -
 201
201 -
 202
202 -
 203
203 -
 204
204 -
 205
205 -
 206
206 -
 207
207 -
 208
208 -
 209
209 -
 210
210 -
 211
211
 |
 |

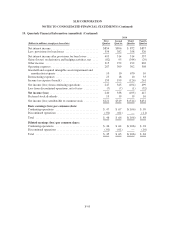
SLM CORPORATION
NOTES TO CONSOLIDATED FINANCIAL STATEMENTS (Continued)
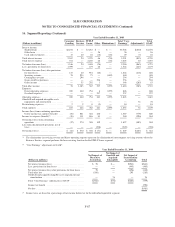
19. Quarterly Financial Information (unaudited) (Continued)
2010
(Dollars in millions, except per share data)
First
Quarter
Second
Quarter
Third
Quarter
Fourth
Quarter
Net interest income ................................. $854 $896 $ 872 $857
Less: provisions for loan losses ....................... 359 382 358 320
Net interest income after provisions for loan losses ........ 495 514 514 537
Gains (losses) on derivative and hedging activities, net .... (82) 95 (344) (29)
Other income ..................................... 315 272 192 603
Operating expenses ................................. 287 309 302 308
Goodwill and acquired intangible assets impairment and
amortization expense ............................. 10 10 670 10
Restructuring expenses .............................. 25 18 10 33
Income tax expense (benefit) ......................... 159 199 (126) 261
Net income (loss) from continuing operations ............ 247 345 (494) 499
Loss from discontinued operations, net of taxes .......... (7) (7) (1) (52)
Net income (loss) .................................. 240 338 (495) 447
Preferred stock dividends ............................ 19 19 19 16
Net income (loss) attributable to common stock .......... $221 $319 $(514) $431
Basic earnings (loss) per common share:
Continuing operations .............................. $.47 $.67 $(1.06) $ .99
Discontinued operations ............................. (.01) (.01) — (.11)
Total ............................................ $.46 $.66 $(1.06) $ .88
Diluted earnings (loss) per common share:
Continuing operations .............................. $.46 $.64 $(1.06) $ .94
Discontinued operations ............................. (.01) (.01) — (.10)
Total ............................................ $.45 $.63 $(1.06) $ .84
F-93