Sallie Mae 2011 Annual Report Download - page 96
Download and view the complete annual report
Please find page 96 of the 2011 Sallie Mae annual report below. You can navigate through the pages in the report by either clicking on the pages listed below, or by using the keyword search tool below to find specific information within the annual report.-
 1
1 -
2
-
3
-
4
-
5
-
6
-
7
-
8
-
9
-
10
-
11
-
12
-
13
-
14
-
15
-
16
-
17
-
18
-
19
-
20
-
21
-
22
-
23
-
24
-
25
-
26
-
27
-
28
-
29
-
30
-
31
-
32
-
33
-
34
-
35
-
36
-
37
-
38
-
39
-
40
-
41
-
42
-
43
-
44
-
45
-
46
-
47
-
48
-
49
-
50
-
51
-
52
-
53
-
54
-
55
-
56
-
57
-
58
-
59
-
60
-
61
-
62
-
63
-
64
-
65
-
66
-
67
-
68
-
69
-
70
-
71
-
72
-
73
-
74
-
75
-
76
-
77
-
78
-
79
-
80
-
81
-
82
-
83
-
84
-
85
-
 86
86 -
 87
87 -
 88
88 -
 89
89 -
 90
90 -
 91
91 -
 92
92 -
 93
93 -
 94
94 -
 95
95 -
 96
96 -
 97
97 -
 98
98 -
 99
99 -
 100
100 -
 101
101 -
 102
102 -
 103
103 -
 104
104 -
 105
105 -
 106
106 -
107
-
108
-
109
-
110
-
111
-
112
-
113
-
114
-
115
-
116
-
117
-
118
-
119
-
120
-
121
-
122
-
123
-
124
-
125
-
126
-
127
-
128
-
129
-
130
-
131
-
132
-
133
-
134
-
135
-
136
-
137
-
138
-
139
-
140
-
141
-
142
-
143
-
144
-
145
-
146
-
147
-
148
-
149
-
150
-
151
-
152
-
153
-
154
-
155
-
156
-
157
-
158
-
159
-
160
-
161
-
162
-
163
-
164
-
165
-
166
-
167
-
168
-
169
-
170
-
171
-
172
-
173
-
174
-
175
-
176
-
177
-
178
-
179
-
180
-
181
-
182
-
183
-
184
-
185
-
186
-
187
-
188
-
189
-
190
-
191
-
192
-
193
-
194
-
195
-
196
-
197
-
198
-
199
-
200
-
201
-
202
-
203
-
204
-
205
-
206
-
207
-
208
-
209
-
210
-
211
 |
 |
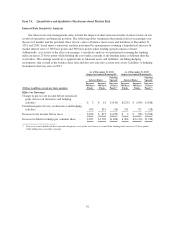
variable debt in low interest rate environments; and (ii) a portion of our variable assets being funded with fixed
rate liabilities and equity. Item (i) will generally cause income to decrease when interest rates increase from a
low interest rate environment, whereas item (ii) will generally offset this decrease. The variance in the change in
pre-tax income before unrealized gains (losses) on derivatives when comparing the 2011 analysis versus the 2010
analysis was the result of the SLC acquisition at December 31, 2010. In the 2010 analysis, the assets from the
acquisition that earn Floor Income were reflected in the analysis at December 31, 2010, however, the Floor
Income Contracts hedging these assets were not entered into until the first half of 2011. Therefore the 2010
analysis reflects a large decrease in this line from the loss of the unhedged Floor Income as rates were increased.
In the 2011 analysis, this Floor Income had been hedged and the increase in the line resulted from a portion of
our variable assets being funded with fixed rate debt. The large increase in the unrealized gains on derivatives
and hedging activities line in the 2011 analysis versus the 2010 analysis, primarily is due to the impact of the
additional Floor Income Contracts discussed above.
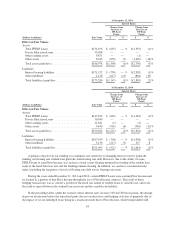
Under the scenario in the tables above labeled “Asset and Funding Index Mismatches,” the main driver of
the decrease in pre-tax income before unrealized gains (losses) on derivative and hedging activities is the result
of LIBOR-based debt funding commercial paper-indexed assets. See “Asset and Liability Funding Gap” of this
Item 7A for a further discussion. Increasing the spread between indices will also impact the unrealized gains
(losses) on derivatives and hedging activities as it relates to basis swaps that hedge the mismatch between the
asset and funding indices.
In addition to interest rate risk addressed in the preceding tables, we are also exposed to risks related to
foreign currency exchange rates. Foreign currency exchange risk is primarily the result of foreign currency
denominated debt issued by us. When we issue foreign denominated corporate unsecured and securitization debt,
our policy is to use cross currency interest rate swaps to swap all foreign currency denominated debt payments
(fixed and floating) to U.S. dollar LIBOR using a fixed exchange rate. In the tables above, there would be an
immaterial impact on earnings if exchange rates were to decrease or increase, due to the terms of the hedging
instrument and hedged items matching. The balance sheet interest bearing liabilities would be affected by a
change in exchange rates; however, the change would be materially offset by the cross currency interest rate
swaps in other assets or other liabilities. In the current economic environment, volatility in the spread between
spot and forward foreign exchange rates has resulted in material mark-to-market impacts to current-period
earnings which have not been factored into the above analysis. The earnings impact is noncash, and at maturity
of the instruments the cumulative mark-to-market impact will be zero.
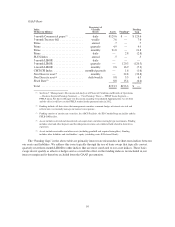
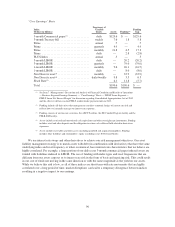
Asset and Liability Funding Gap
The tables below present our assets and liabilities (funding) arranged by underlying indices as of
December 31, 2011. In the following GAAP presentation, the funding gap only includes derivatives that qualify
as effective hedges (those derivatives which are reflected in net interest margin, as opposed to those reflected in
the “gains (losses) on derivatives and hedging activities, net” line on the consolidated statements of income). The
difference between the asset and the funding is the funding gap for the specified index. This represents our
exposure to interest rate risk in the form of basis risk and repricing risk, which is the risk that the different indices
may reset at different frequencies or may not move in the same direction or at the same magnitude.
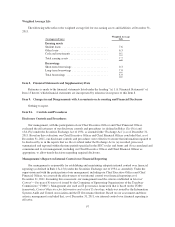
Management analyzes interest rate risk and in doing so includes all derivatives that are economically
hedging our debt whether they qualify as effective hedges or not (“Core Earnings” basis). Accordingly, we are
also presenting the asset and liability funding gap on a “Core Earnings” basis in the table that follows the GAAP
presentation.
94