Sallie Mae 2011 Annual Report Download - page 61
Download and view the complete annual report
Please find page 61 of the 2011 Sallie Mae annual report below. You can navigate through the pages in the report by either clicking on the pages listed below, or by using the keyword search tool below to find specific information within the annual report.-
 1
1 -
2
-
3
-
4
-
5
-
6
-
7
-
8
-
9
-
10
-
11
-
12
-
13
-
14
-
15
-
16
-
17
-
18
-
19
-
20
-
21
-
22
-
23
-
24
-
25
-
26
-
27
-
28
-
29
-
30
-
31
-
32
-
33
-
34
-
35
-
36
-
37
-
38
-
39
-
40
-
41
-
42
-
43
-
44
-
45
-
46
-
47
-
48
-
49
-
50
-
 51
51 -
 52
52 -
 53
53 -
 54
54 -
 55
55 -
 56
56 -
 57
57 -
 58
58 -
 59
59 -
 60
60 -
 61
61 -
 62
62 -
 63
63 -
 64
64 -
 65
65 -
 66
66 -
 67
67 -
 68
68 -
 69
69 -
 70
70 -
 71
71 -
72
-
73
-
74
-
75
-
76
-
77
-
78
-
79
-
80
-
81
-
82
-
83
-
84
-
85
-
86
-
87
-
88
-
89
-
90
-
91
-
92
-
93
-
94
-
95
-
96
-
97
-
98
-
99
-
100
-
101
-
102
-
103
-
104
-
105
-
106
-
107
-
108
-
109
-
110
-
111
-
112
-
113
-
114
-
115
-
116
-
117
-
118
-
119
-
120
-
121
-
122
-
123
-
124
-
125
-
126
-
127
-
128
-
129
-
130
-
131
-
132
-
133
-
134
-
135
-
136
-
137
-
138
-
139
-
140
-
141
-
142
-
143
-
144
-
145
-
146
-
147
-
148
-
149
-
150
-
151
-
152
-
153
-
154
-
155
-
156
-
157
-
158
-
159
-
160
-
161
-
162
-
163
-
164
-
165
-
166
-
167
-
168
-
169
-
170
-
171
-
172
-
173
-
174
-
175
-
176
-
177
-
178
-
179
-
180
-
181
-
182
-
183
-
184
-
185
-
186
-
187
-
188
-
189
-
190
-
191
-
192
-
193
-
194
-
195
-
196
-
197
-
198
-
199
-
200
-
201
-
202
-
203
-
204
-
205
-
206
-
207
-
208
-
209
-
210
-
211
 |
 |

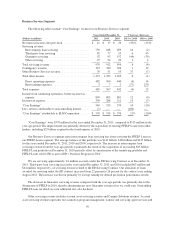
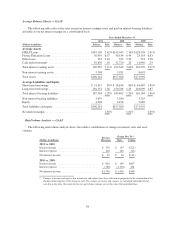
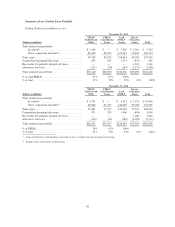
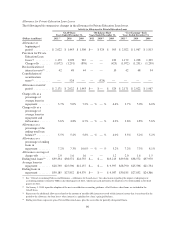
Summary of our Student Loan Portfolio
Ending Student Loan Balances, net
December 31, 2011
(Dollars in millions)
FFELP
Stafford and
Other
FFELP
Consolidation
Loans
Total
FFELP
Loans
Private
Education
Loans Total
Total student loan portfolio:
In-school(1) .............................. $ 3,100 $ — $ 3,100 $ 2,263 $ 5,363
Grace, repayment and other(2) ................ 46,618 86,925 133,543 35,830 169,373
Total, gross .................................. 49,718 86,925 136,643 38,093 174,736
Unamortized premium/(discount) ................. 839 835 1,674 (873) 801
Receivable for partially charged-off loans .......... — — — 1,241 1,241
Allowance for losses ........................... (117) (70) (187) (2,171) (2,358)
Total student loan portfolio ...................... $50,440 $87,690 $138,130 $36,290 $174,420
% of total FFELP ............................. 37% 63% 100%
% of total .................................... 29% 50% 79% 21% 100%
December 31, 2010
(Dollars in millions)
FFELP
Stafford and
Other
FFELP
Consolidation
Loans
Total
FFELP
Private
Education
Loans Total
Total student loan portfolio:
In-school(1) .............................. $ 6,333 $ — $ 6,333 $ 3,752 $ 10,085
Grace, repayment and other(2) ................ 49,068 91,537 140,605 33,780 174,385
Total, gross .................................. 55,401 91,537 146,938 37,532 184,470
Unamortized premium/(discount) ................. 971 929 1,900 (894) 1,006
Receivable for partially charged-off loans .......... — — — 1,040 1,040
Allowance for losses ........................... (120) (69) (189) (2,022) (2,211)
Total student loan portfolio ...................... $56,252 $92,397 $148,649 $35,656 $184,305
% of FFELP ................................. 38% 62% 100%
% of total .................................... 31% 50% 81% 19% 100%
(1) Loans for borrowers still attending school and are not yet required to make payments on the loan.
(2) Includes loans in deferment or forbearance.
59