PNC Bank 2013 Annual Report Download - page 98
Download and view the complete annual report
Please find page 98 of the 2013 PNC Bank annual report below. You can navigate through the pages in the report by either clicking on the pages listed below, or by using the keyword search tool below to find specific information within the annual report.-
 1
1 -
2
-
3
-
4
-
5
-
6
-
7
-
8
-
9
-
10
-
11
-
12
-
13
-
14
-
15
-
16
-
17
-
18
-
19
-
20
-
21
-
22
-
23
-
24
-
25
-
26
-
27
-
28
-
29
-
30
-
31
-
32
-
33
-
34
-
35
-
36
-
37
-
38
-
39
-
40
-
41
-
42
-
43
-
44
-
45
-
46
-
47
-
48
-
49
-
50
-
51
-
52
-
53
-
54
-
55
-
56
-
57
-
58
-
59
-
60
-
61
-
62
-
63
-
64
-
65
-
66
-
67
-
68
-
69
-
70
-
71
-
72
-
73
-
74
-
75
-
76
-
77
-
78
-
79
-
80
-
81
-
82
-
83
-
84
-
85
-
86
-
87
-
 88
88 -
 89
89 -
 90
90 -
 91
91 -
 92
92 -
 93
93 -
 94
94 -
 95
95 -
 96
96 -
 97
97 -
 98
98 -
 99
99 -
 100
100 -
 101
101 -
 102
102 -
 103
103 -
 104
104 -
 105
105 -
 106
106 -
 107
107 -
 108
108 -
109
-
110
-
111
-
112
-
113
-
114
-
115
-
116
-
117
-
118
-
119
-
120
-
121
-
122
-
123
-
124
-
125
-
126
-
127
-
128
-
129
-
130
-
131
-
132
-
133
-
134
-
135
-
136
-
137
-
138
-
139
-
140
-
141
-
142
-
143
-
144
-
145
-
146
-
147
-
148
-
149
-
150
-
151
-
152
-
153
-
154
-
155
-
156
-
157
-
158
-
159
-
160
-
161
-
162
-
163
-
164
-
165
-
166
-
167
-
168
-
169
-
170
-
171
-
172
-
173
-
174
-
175
-
176
-
177
-
178
-
179
-
180
-
181
-
182
-
183
-
184
-
185
-
186
-
187
-
188
-
189
-
190
-
191
-
192
-
193
-
194
-
195
-
196
-
197
-
198
-
199
-
200
-
201
-
202
-
203
-
204
-
205
-
206
-
207
-
208
-
209
-
210
-
211
-
212
-
213
-
214
-
215
-
216
-
217
-
218
-
219
-
220
-
221
-
222
-
223
-
224
-
225
-
226
-
227
-
228
-
229
-
230
-
231
-
232
-
233
-
234
-
235
-
236
-
237
-
238
-
239
-
240
-
241
-
242
-
243
-
244
-
245
-
246
-
247
-
248
-
249
-
250
-
251
-
252
-
253
-
254
-
255
-
256
-
257
-
258
-
259
-
260
-
261
-
262
-
263
-
264
-
265
-
266
 |
 |

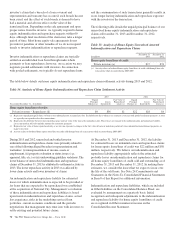
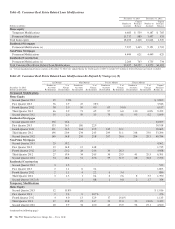
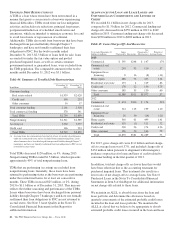
Table 42: Consumer Real Estate Related Loan Modifications
December 31, 2013 December 31, 2012
Dollars in millions
Number of
Accounts
Unpaid
Principal
Balance
Number of
Accounts
Unpaid
Principal
Balance
Home equity
Temporary Modifications 6,683 $ 539 9,187 $ 785
Permanent Modifications 11,717 889 7,457 535
Total home equity 18,400 1,428 16,644 1,320
Residential Mortgages
Permanent Modifications (a) 7,397 1,445 9,151 1,702
Non-Prime Mortgages
Permanent Modifications 4,400 621 4,449 629
Residential Construction
Permanent Modifications (a) 2,260 763 1,735 734
Total Consumer Real Estate Related Loan Modifications 32,457 $4,257 31,979 $4,385
(a) Certain unpaid principal balance amounts at December 31, 2012 were updated during the fourth quarter of 2013 to include $151 million of deferred balances previously excluded.
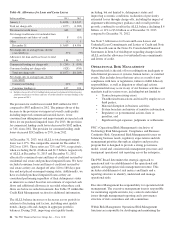
Table 43: Consumer Real Estate Related Loan Modifications Re-Default by Vintage (a) (b)
Six Months Nine Months Twelve Months Fifteen Months
December 31, 2013
Dollars in thousands
Number of
Accounts
Re-defaulted
%of
Vintage
Re-defaulted
Number of
Accounts
Re-defaulted
%of
Vintage
Re-defaulted
Number of
Accounts
Re-defaulted
%of
Vintage
Re-defaulted
Number of
Accounts
Re-defaulted
%of
Vintage
Re-defaulted
Unpaid
Principal
Balance (c)
Permanent Modifications
Home Equity
Second Quarter 2013 25 2.0% $ 2,802
First Quarter 2013 36 2.9 47 3.8% 3,546
Fourth Quarter 2012 38 3.0 50 4.0 63 5.0% 6,157
Third Quarter 2012 46 2.9 73 4.5 97 6.0 110 6.8% 9,452
Second Quarter 2012 35 2.0 59 3.3 73 4.1 93 5.2 5,899
Residential Mortgages
Second Quarter 2013 136 16.4 24,057
First Quarter 2013 133 16.3 186 22.9 30,918
Fourth Quarter 2012 121 16.5 204 27.9 235 32.1 39,605
Third Quarter 2012 196 20.4 234 24.3 299 31.1 318 33.0 53,296
Second Quarter 2012 149 14.8 259 25.8 267 26.6 294 29.3 40,784
Non-Prime Mortgages
Second Quarter 2013 25 19.2 4,962
First Quarter 2013 12 14.8 12 14.8 1,735
Fourth Quarter 2012 23 20.2 28 24.6 30 26.3 4,058
Third Quarter 2012 27 19.4 34 24.5 36 25.9 41 29.5 6,391
Second Quarter 2012 34 18.4 51 27.6 59 31.9 68 36.8 7,702
Residential Construction
Second Quarter 2013 3 1.5 532
First Quarter 2013 2 1.1 6 3.4 1,803
Fourth Quarter 2012 2 1.1 4 2.2 6 3.4 886
Third Quarter 2012 3 1.3 1 0.4 6 2.6 8 3.5 1,390
Second Quarter 2012 (d) – – 1 0.8 1 0.8 2 1.7 354
Temporary Modifications
Home Equity
Second Quarter 2013 12 15.8% $ 1,016
First Quarter 2013 2 2.4 9 10.7% 476
Fourth Quarter 2012 4 4.0 13 12.9 17 16.8% 1,113
Third Quarter 2012 17 10.8 23 14.7 33 21.0 33 21.0% 2,439
Second Quarter 2012 28 9.9 34 12.0 45 15.9 54 19.1 4,560
(continued on following page)
80 The PNC Financial Services Group, Inc. – Form 10-K