PNC Bank 2013 Annual Report Download - page 78
Download and view the complete annual report
Please find page 78 of the 2013 PNC Bank annual report below. You can navigate through the pages in the report by either clicking on the pages listed below, or by using the keyword search tool below to find specific information within the annual report.-
 1
1 -
2
-
3
-
4
-
5
-
6
-
7
-
8
-
9
-
10
-
11
-
12
-
13
-
14
-
15
-
16
-
17
-
18
-
19
-
20
-
21
-
22
-
23
-
24
-
25
-
26
-
27
-
28
-
29
-
30
-
31
-
32
-
33
-
34
-
35
-
36
-
37
-
38
-
39
-
40
-
41
-
42
-
43
-
44
-
45
-
46
-
47
-
48
-
49
-
50
-
51
-
52
-
53
-
54
-
55
-
56
-
57
-
58
-
59
-
60
-
61
-
62
-
63
-
64
-
65
-
66
-
67
-
 68
68 -
 69
69 -
 70
70 -
 71
71 -
 72
72 -
 73
73 -
 74
74 -
 75
75 -
 76
76 -
 77
77 -
 78
78 -
 79
79 -
 80
80 -
 81
81 -
 82
82 -
 83
83 -
 84
84 -
 85
85 -
 86
86 -
 87
87 -
 88
88 -
89
-
90
-
91
-
92
-
93
-
94
-
95
-
96
-
97
-
98
-
99
-
100
-
101
-
102
-
103
-
104
-
105
-
106
-
107
-
108
-
109
-
110
-
111
-
112
-
113
-
114
-
115
-
116
-
117
-
118
-
119
-
120
-
121
-
122
-
123
-
124
-
125
-
126
-
127
-
128
-
129
-
130
-
131
-
132
-
133
-
134
-
135
-
136
-
137
-
138
-
139
-
140
-
141
-
142
-
143
-
144
-
145
-
146
-
147
-
148
-
149
-
150
-
151
-
152
-
153
-
154
-
155
-
156
-
157
-
158
-
159
-
160
-
161
-
162
-
163
-
164
-
165
-
166
-
167
-
168
-
169
-
170
-
171
-
172
-
173
-
174
-
175
-
176
-
177
-
178
-
179
-
180
-
181
-
182
-
183
-
184
-
185
-
186
-
187
-
188
-
189
-
190
-
191
-
192
-
193
-
194
-
195
-
196
-
197
-
198
-
199
-
200
-
201
-
202
-
203
-
204
-
205
-
206
-
207
-
208
-
209
-
210
-
211
-
212
-
213
-
214
-
215
-
216
-
217
-
218
-
219
-
220
-
221
-
222
-
223
-
224
-
225
-
226
-
227
-
228
-
229
-
230
-
231
-
232
-
233
-
234
-
235
-
236
-
237
-
238
-
239
-
240
-
241
-
242
-
243
-
244
-
245
-
246
-
247
-
248
-
249
-
250
-
251
-
252
-
253
-
254
-
255
-
256
-
257
-
258
-
259
-
260
-
261
-
262
-
263
-
264
-
265
-
266
 |
 |

B
LACK
R
OCK
(Unaudited)
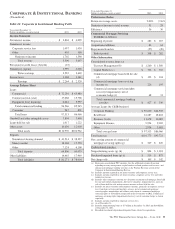
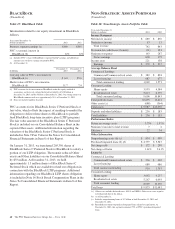
Table 27: BlackRock Table
Information related to our equity investment in BlackRock
follows:
Year ended December 31
Dollars in millions 2013 2012
Business segment earnings (a) $469 $395
PNC’s economic interest in
BlackRock (b) 22% 22%
(a) Includes PNC’s share of BlackRock’s reported GAAP earnings and additional
income taxes on those earnings incurred by PNC.
(b) At December 31.
In billions
December 31
2013
December 31
2012
Carrying value of PNC’s investment in
BlackRock (c) $ 6.0 $5.6
Market value of PNC’s investment in
BlackRock (d) 11.7 7.4
(c) PNC accounts for its investment in BlackRock under the equity method of
accounting, exclusive of a related deferred tax liability of $2.0 billion at
December 31, 2013 and $1.9 billion at December 31, 2012. Our voting interest in
BlackRock common stock was approximately 21% at December 31, 2013.
(d) Does not include liquidity discount.
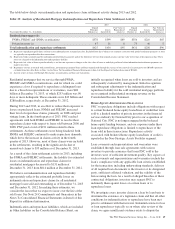
PNC accounts for its BlackRock Series C Preferred Stock at
fair value, which offsets the impact of marking-to-market the
obligation to deliver these shares to BlackRock to partially
fund BlackRock long-term incentive plan (LTIP) programs.
The fair value amount of the BlackRock Series C Preferred
Stock is included on our Consolidated Balance Sheet in the
caption Other assets. Additional information regarding the
valuation of the BlackRock Series C Preferred Stock is
included in Note 9 Fair Value in the Notes To Consolidated
Financial Statements in Item 8 of this Report.
On January 31, 2013, we transferred 205,350 shares of
BlackRock Series C Preferred Stock to BlackRock to satisfy a
portion of our LTIP obligation. The transfer reduced Other
assets and Other liabilities on our Consolidated Balance Sheet
by $33 million. At December 31, 2013, we hold
approximately 1.3 million shares of BlackRock Series C
Preferred Stock which are available to fund our obligation in
connection with the BlackRock LTIP programs. Additional
information regarding our BlackRock LTIP shares obligation
is included in Note 16 Stock Based Compensation Plans in the
Notes To Consolidated Financial Statements in Item 8 of this
Report.
N
ON
-S
TRATEGIC
A
SSETS
P
ORTFOLIO
(Unaudited)
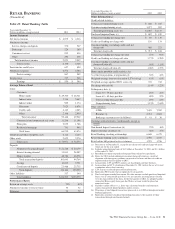
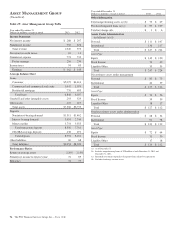
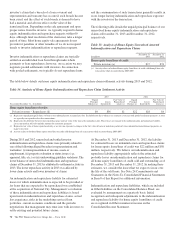
Table 28: Non-Strategic Assets Portfolio Table
Year ended December 31
Dollars in millions 2013 2012
Income Statement
Net interest income $ 689 $ 830
Noninterest income 53 13
Total revenue 742 843
Provision for credit losses (benefit) (21) 181
Noninterest expense 163 287
Pretax earnings 600 375
Income taxes 221 138
Earnings $ 379 $ 237
Average Balance Sheet
Commercial Lending:
Commercial/Commercial real estate $ 382 $ 894
Lease financing 687 677
Total commercial lending 1,069 1,571
Consumer Lending:
Home equity 3,993 4,584
Residential real estate 5,613 6,259
Total consumer lending 9,606 10,843
Total portfolio loans 10,675 12,414
Other assets (a) (688) (364)
Total assets $ 9,987 $12,050
Deposits and other liabilities $ 236 $ 183
Total liabilities $ 236 $ 183
Performance Ratios
Return on average assets 3.79% 1.97%
Noninterest income to total revenue 7 2
Efficiency 22 34
Other Information
Nonperforming assets (b) (c) $ 834 $ 999
Purchased impaired loans (b) (d) $ 4,797 $ 5,547
Net charge-offs $ 172 $ 299
Net charge-off ratio 1.61% 2.41%
Loans (b)
Commercial Lending
Commercial/Commercial real estate $ 236 $ 665
Lease financing 680 686
Total commercial lending 916 1,351
Consumer Lending
Home equity 3,692 4,237
Residential real estate 5,267 6,093
Total consumer lending 8,959 10,330
Total loans $ 9,875 $11,681
(a) Other assets includes deferred taxes, ALLL and OREO. Other assets were negative
in both periods due to the ALLL.
(b) As of December 31.
(c) Includes nonperforming loans of $.7 billion at both December 31, 2013 and
December 31, 2012.
(d) Recorded investment of purchased impaired loans related to acquisitions. At
December 31, 2013, this segment contained 79% of PNC’s purchased impaired
loans.
60 The PNC Financial Services Group, Inc. – Form 10-K