PNC Bank 2013 Annual Report Download - page 169
Download and view the complete annual report
Please find page 169 of the 2013 PNC Bank annual report below. You can navigate through the pages in the report by either clicking on the pages listed below, or by using the keyword search tool below to find specific information within the annual report.-
 1
1 -
2
-
3
-
4
-
5
-
6
-
7
-
8
-
9
-
10
-
11
-
12
-
13
-
14
-
15
-
16
-
17
-
18
-
19
-
20
-
21
-
22
-
23
-
24
-
25
-
26
-
27
-
28
-
29
-
30
-
31
-
32
-
33
-
34
-
35
-
36
-
37
-
38
-
39
-
40
-
41
-
42
-
43
-
44
-
45
-
46
-
47
-
48
-
49
-
50
-
51
-
52
-
53
-
54
-
55
-
56
-
57
-
58
-
59
-
60
-
61
-
62
-
63
-
64
-
65
-
66
-
67
-
68
-
69
-
70
-
71
-
72
-
73
-
74
-
75
-
76
-
77
-
78
-
79
-
80
-
81
-
82
-
83
-
84
-
85
-
86
-
87
-
88
-
89
-
90
-
91
-
92
-
93
-
94
-
95
-
96
-
97
-
98
-
99
-
100
-
101
-
102
-
103
-
104
-
105
-
106
-
107
-
108
-
109
-
110
-
111
-
112
-
113
-
114
-
115
-
116
-
117
-
118
-
119
-
120
-
121
-
122
-
123
-
124
-
125
-
126
-
127
-
128
-
129
-
130
-
131
-
132
-
133
-
134
-
135
-
136
-
137
-
138
-
139
-
140
-
141
-
142
-
143
-
144
-
145
-
146
-
147
-
148
-
149
-
150
-
151
-
152
-
153
-
154
-
155
-
156
-
157
-
158
-
 159
159 -
 160
160 -
 161
161 -
 162
162 -
 163
163 -
 164
164 -
 165
165 -
 166
166 -
 167
167 -
 168
168 -
 169
169 -
 170
170 -
 171
171 -
 172
172 -
 173
173 -
 174
174 -
 175
175 -
 176
176 -
 177
177 -
 178
178 -
 179
179 -
180
-
181
-
182
-
183
-
184
-
185
-
186
-
187
-
188
-
189
-
190
-
191
-
192
-
193
-
194
-
195
-
196
-
197
-
198
-
199
-
200
-
201
-
202
-
203
-
204
-
205
-
206
-
207
-
208
-
209
-
210
-
211
-
212
-
213
-
214
-
215
-
216
-
217
-
218
-
219
-
220
-
221
-
222
-
223
-
224
-
225
-
226
-
227
-
228
-
229
-
230
-
231
-
232
-
233
-
234
-
235
-
236
-
237
-
238
-
239
-
240
-
241
-
242
-
243
-
244
-
245
-
246
-
247
-
248
-
249
-
250
-
251
-
252
-
253
-
254
-
255
-
256
-
257
-
258
-
259
-
260
-
261
-
262
-
263
-
264
-
265
-
266
 |
 |

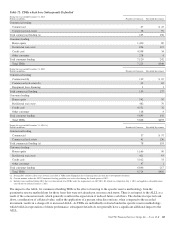
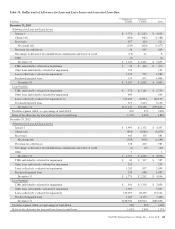
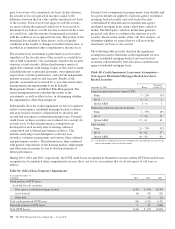
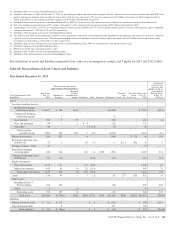
Table 79 presents gross unrealized losses on securities available for sale at December 31, 2013 and December 31, 2012. The
securities are segregated between investments that have been in a continuous unrealized loss position for less than twelve months
and twelve months or more based on the point in time that the fair value declined below the amortized cost basis. The table
includes debt securities where a portion of other-than-temporary impairment (OTTI) has been recognized in Accumulated other
comprehensive income (loss).
Table 79: Gross Unrealized Loss and Fair Value of Securities Available for Sale
Unrealized loss position
less than 12 months
Unrealized loss position
12 months or more Total
In millions
Unrealized
Loss
Fair
Value
Unrealized
Loss
Fair
Value
Unrealized
Loss
Fair
Value
December 31, 2013
Debt securities
U.S. Treasury and government agencies $ (7) $ 1,066 $ (7) $ 1,066
Residential mortgage-backed
Agency (210) 7,950 $ (12) $ 293 (222) 8,243
Non-agency (18) 855 (142) 1,719 (160) 2,574
Commercial mortgage-backed
Agency (1) 23 (1) 23
Non-agency (18) 1,315 14 (18) 1,329
Asset-backed (11) 1,752 (37) 202 (48) 1,954
State and municipal (23) 897 (21) 286 (44) 1,183
Other debt (17) 844 (1) 12 (18) 856
Total debt securities (305) 14,702 (213) 2,526 (518) 17,228
Corporate stocks and other (1) 15 (1) 15
Total $(306) $14,717 $(213) $2,526 $(519) $17,243
December 31, 2012
Debt securities
Residential mortgage-backed
Agency $ (9) $ 1,128 $ (3) $ 121 $ (12) $ 1,249
Non-agency (3) 219 (306) 3,185 (309) 3,404
Commercial mortgage-backed
Non-agency (1) 60 (1) 60
Asset-backed (1) 370 (78) 625 (79) 995
State and municipal (2) 240 (19) 518 (21) 758
Other debt (2) 61 (2) 15 (4) 76
Total $ (18) $ 2,078 $(408) $4,464 $(426) $ 6,542
The gross unrealized loss on debt securities held to maturity
was $98 million at December 31, 2013 and less than $1
million at December 31, 2012. The majority of the gross
unrealized loss at December 31, 2013 related to agency
residential mortgage-backed securities. The fair value of debt
securities held to maturity that were in a continuous loss
position for less than 12 months was $3.6 billion and $73
million at December 31, 2013 and December 31, 2012,
respectively, and positions that were in a continuous loss
position for 12 months or more were $48 million and $56
million at December 31, 2013 and December 31, 2012,
respectively. For securities transferred to held to maturity
from available for sale, the unrealized loss for purposes of this
analysis is determined by comparing the security’s original
amortized cost to its current estimated fair value.
E
VALUATING
I
NVESTMENT
S
ECURITIES
F
OR
O
THER
-
THAN
-
T
EMPORARY
I
MPAIRMENTS
For the securities in the preceding Table 79, as of
December 31, 2013 we do not intend to sell and believe we
will not be required to sell the securities prior to recovery of
the amortized cost basis.
On at least a quarterly basis, we conduct a comprehensive
security-level assessment on all securities. For those securities
in an unrealized loss position we determine if OTTI exists. An
unrealized loss exists when the current fair value of an
individual security is less than its amortized cost basis. An
OTTI loss must be recognized for a debt security in an
unrealized loss position if we intend to sell the security or it is
more likely than not we will be required to sell the security
The PNC Financial Services Group, Inc. – Form 10-K 151