PNC Bank 2013 Annual Report Download - page 203
Download and view the complete annual report
Please find page 203 of the 2013 PNC Bank annual report below. You can navigate through the pages in the report by either clicking on the pages listed below, or by using the keyword search tool below to find specific information within the annual report.-
 1
1 -
2
-
3
-
4
-
5
-
6
-
7
-
8
-
9
-
10
-
11
-
12
-
13
-
14
-
15
-
16
-
17
-
18
-
19
-
20
-
21
-
22
-
23
-
24
-
25
-
26
-
27
-
28
-
29
-
30
-
31
-
32
-
33
-
34
-
35
-
36
-
37
-
38
-
39
-
40
-
41
-
42
-
43
-
44
-
45
-
46
-
47
-
48
-
49
-
50
-
51
-
52
-
53
-
54
-
55
-
56
-
57
-
58
-
59
-
60
-
61
-
62
-
63
-
64
-
65
-
66
-
67
-
68
-
69
-
70
-
71
-
72
-
73
-
74
-
75
-
76
-
77
-
78
-
79
-
80
-
81
-
82
-
83
-
84
-
85
-
86
-
87
-
88
-
89
-
90
-
91
-
92
-
93
-
94
-
95
-
96
-
97
-
98
-
99
-
100
-
101
-
102
-
103
-
104
-
105
-
106
-
107
-
108
-
109
-
110
-
111
-
112
-
113
-
114
-
115
-
116
-
117
-
118
-
119
-
120
-
121
-
122
-
123
-
124
-
125
-
126
-
127
-
128
-
129
-
130
-
131
-
132
-
133
-
134
-
135
-
136
-
137
-
138
-
139
-
140
-
141
-
142
-
143
-
144
-
145
-
146
-
147
-
148
-
149
-
150
-
151
-
152
-
153
-
154
-
155
-
156
-
157
-
158
-
159
-
160
-
161
-
162
-
163
-
164
-
165
-
166
-
167
-
168
-
169
-
170
-
171
-
172
-
173
-
174
-
175
-
176
-
177
-
178
-
179
-
180
-
181
-
182
-
183
-
184
-
185
-
186
-
187
-
188
-
189
-
190
-
191
-
192
-
 193
193 -
 194
194 -
 195
195 -
 196
196 -
 197
197 -
 198
198 -
 199
199 -
 200
200 -
 201
201 -
 202
202 -
 203
203 -
 204
204 -
 205
205 -
 206
206 -
 207
207 -
 208
208 -
 209
209 -
 210
210 -
 211
211 -
 212
212 -
 213
213 -
214
-
215
-
216
-
217
-
218
-
219
-
220
-
221
-
222
-
223
-
224
-
225
-
226
-
227
-
228
-
229
-
230
-
231
-
232
-
233
-
234
-
235
-
236
-
237
-
238
-
239
-
240
-
241
-
242
-
243
-
244
-
245
-
246
-
247
-
248
-
249
-
250
-
251
-
252
-
253
-
254
-
255
-
256
-
257
-
258
-
259
-
260
-
261
-
262
-
263
-
264
-
265
-
266
 |
 |

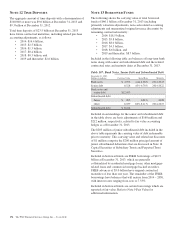
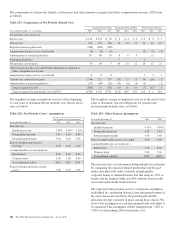
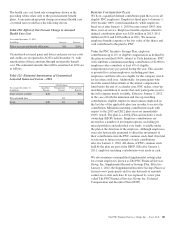
The health care cost trend rate assumptions shown in the
preceding tables relate only to the postretirement benefit
plans. A one-percentage-point change in assumed health care
cost trend rates would have the following effects.
Table 120: Effect of One Percent Change in Assumed
Health Care Cost
Year ended December 31, 2013
In millions Increase Decrease
Effect on year end benefit obligation $11 $(10)
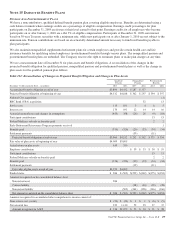
Unamortized actuarial gains and losses and prior service costs
and credits are recognized in AOCI each December 31, with
amortization of these amounts through net periodic benefit
cost. The estimated amounts that will be amortized in 2014 are
as follows.
Table 121: Estimated Amortization of Unamortized
Actuarial Gains and Losses – 2014
2014 Estimate
Year ended December 31
In millions
Qualified
Pension
Nonqualified
Pension
Postretirement
Benefits
Prior service (credit) $(8) $(2)
Net actuarial loss $3
Total $(8) $3 $(2)
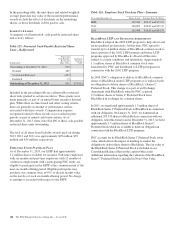
D
EFINED
C
ONTRIBUTION
P
LANS
We have a qualified defined contribution plan that covers all
eligible PNC employees. Employees hired prior to January 1,
2010 became 100% vested immediately, while employees
hired on or after January 1, 2010 become vested 100% after
three years of service. Employee benefits expense related to
defined contribution plans was $120 million in 2013, $111
million in 2012 and $105 million in 2011. We measure
employee benefits expense as the fair value of the shares and
cash contributed to the plan by PNC.
Under the PNC Incentive Savings Plan, employee
contributions up to 4% of eligible compensation as defined by
the plan are matched 100%, subject to Code limitations. PNC
will contribute a minimum matching contribution of $2,000 to
employees who contribute at least 4% of eligible
compensation every pay period during the year. This amount
is prorated for certain employees, including part-time
employees and those who are eligible for the company match
for less than a full year. Additionally, for participants who
meet the annual deferral limit or the annual compensation
limit before the end of a calendar year, PNC makes a true-up
matching contribution to ensure that such participants receive
the full company match available. Effective January 1, 2012,
in the case of both the minimum and true-up matching
contributions, eligible employees must remain employed on
the last day of the applicable plan year in order to receive the
contribution. Minimum matching contributions made with
respect to the 2013 and 2012 plan years are immediately
100% vested. The plan is a 401(k) Plan and includes a stock
ownership (ESOP) feature. Employee contributions are
invested in a number of investment options, including pre
mixed portfolios and individual core funds, available under
the plan at the direction of the employee. Although employees
were also historically permitted to direct the investment of
their contributions into the PNC common stock fund, this fund
was frozen to future investments of such contributions
effective January 1, 2010. All shares of PNC common stock
held by the plan are part of the ESOP. Effective January 1,
2011, employer matching contributions were made in cash.
We also maintain a nonqualified supplemental savings plan
for certain employees, known as The PNC Financial Services
Group, Inc. Supplemental Incentive Savings Plan. Effective
January 1, 2012, the Supplemental Incentive Savings Plan was
frozen to new participants and for any deferrals of amounts
earned on or after such date. It was replaced by a new plan
called The PNC Financial Services Group, Inc. Deferred
Compensation and Incentive Plan (DCIP).
The PNC Financial Services Group, Inc. – Form 10-K 185