PNC Bank 2013 Annual Report Download - page 189
Download and view the complete annual report
Please find page 189 of the 2013 PNC Bank annual report below. You can navigate through the pages in the report by either clicking on the pages listed below, or by using the keyword search tool below to find specific information within the annual report.-
 1
1 -
2
-
3
-
4
-
5
-
6
-
7
-
8
-
9
-
10
-
11
-
12
-
13
-
14
-
15
-
16
-
17
-
18
-
19
-
20
-
21
-
22
-
23
-
24
-
25
-
26
-
27
-
28
-
29
-
30
-
31
-
32
-
33
-
34
-
35
-
36
-
37
-
38
-
39
-
40
-
41
-
42
-
43
-
44
-
45
-
46
-
47
-
48
-
49
-
50
-
51
-
52
-
53
-
54
-
55
-
56
-
57
-
58
-
59
-
60
-
61
-
62
-
63
-
64
-
65
-
66
-
67
-
68
-
69
-
70
-
71
-
72
-
73
-
74
-
75
-
76
-
77
-
78
-
79
-
80
-
81
-
82
-
83
-
84
-
85
-
86
-
87
-
88
-
89
-
90
-
91
-
92
-
93
-
94
-
95
-
96
-
97
-
98
-
99
-
100
-
101
-
102
-
103
-
104
-
105
-
106
-
107
-
108
-
109
-
110
-
111
-
112
-
113
-
114
-
115
-
116
-
117
-
118
-
119
-
120
-
121
-
122
-
123
-
124
-
125
-
126
-
127
-
128
-
129
-
130
-
131
-
132
-
133
-
134
-
135
-
136
-
137
-
138
-
139
-
140
-
141
-
142
-
143
-
144
-
145
-
146
-
147
-
148
-
149
-
150
-
151
-
152
-
153
-
154
-
155
-
156
-
157
-
158
-
159
-
160
-
161
-
162
-
163
-
164
-
165
-
166
-
167
-
168
-
169
-
170
-
171
-
172
-
173
-
174
-
175
-
176
-
177
-
178
-
 179
179 -
 180
180 -
 181
181 -
 182
182 -
 183
183 -
 184
184 -
 185
185 -
 186
186 -
 187
187 -
 188
188 -
 189
189 -
 190
190 -
 191
191 -
 192
192 -
 193
193 -
 194
194 -
 195
195 -
 196
196 -
 197
197 -
 198
198 -
 199
199 -
200
-
201
-
202
-
203
-
204
-
205
-
206
-
207
-
208
-
209
-
210
-
211
-
212
-
213
-
214
-
215
-
216
-
217
-
218
-
219
-
220
-
221
-
222
-
223
-
224
-
225
-
226
-
227
-
228
-
229
-
230
-
231
-
232
-
233
-
234
-
235
-
236
-
237
-
238
-
239
-
240
-
241
-
242
-
243
-
244
-
245
-
246
-
247
-
248
-
249
-
250
-
251
-
252
-
253
-
254
-
255
-
256
-
257
-
258
-
259
-
260
-
261
-
262
-
263
-
264
-
265
-
266
 |
 |
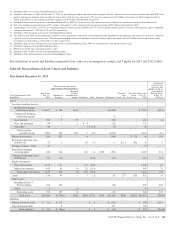
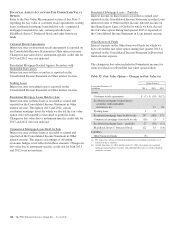
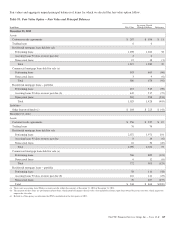
The aggregate fair values in the table above do not represent
the total market value of PNC’s assets and liabilities as the
table excludes the following:
• real and personal property,
• lease financing,
• loan customer relationships,
• deposit customer intangibles,
• retail branch networks,
• fee-based businesses, such as asset management and
brokerage, and
• trademarks and brand names.
We used the following methods and assumptions to estimate
fair value amounts for financial instruments.
G
ENERAL
For short-term financial instruments realizable in three months
or less, the carrying amount reported on our Consolidated
Balance Sheet approximates fair value. Unless otherwise
stated, the rates used in discounted cash flow analyses are
based on market yield curves.
C
ASH AND DUE FROM BANKS
The carrying amounts reported on our Consolidated Balance
Sheet for cash and due from banks approximate fair values.
For purposes of this disclosure only, cash and due from banks
includes the following:
• due from banks, and
• non-interest-earning deposits with banks.
Cash and due from banks are classified as Level 1.
S
HORT
-T
ERM
A
SSETS
The carrying amounts reported on our Consolidated Balance
Sheet for short-term investments approximate fair values
primarily due to their short-term nature. For purposes of this
disclosure only, short-term assets include the following:
• federal funds sold and resale agreements,
• cash collateral,
• customers’ acceptances,
• accrued interest receivable, and
• interest-earning deposits with banks.
Short-term assets are classified as Level 2.
S
ECURITIES
Securities include both the investment securities (comprised of
available for sale and held to maturity securities) and trading
securities portfolios. We primarily use prices obtained from
pricing services, dealer quotes or recent trades to determine
the fair value of securities. As of December 31, 2013, 83% of
the positions in these portfolios were priced by pricing
services provided by third-party vendors. Refer to the Fair
Value Measurement section of this Note 9 for additional
information relating to our pricing processes and procedures.
T
RADING
L
OANS
Refer to the Fair Value Measurement section of this Note 9
regarding the fair value of trading loans.
N
ET
L
OANS AND
L
OANS
H
ELD
F
OR
S
ALE
Fair values are estimated based on the discounted value of
expected net cash flows incorporating assumptions about
prepayment rates, net credit losses and servicing fees. For
purchased impaired loans, fair value is assumed to equal
PNC’s carrying value, which represents the present value of
expected future principal and interest cash flows, as adjusted
for any ALLL recorded for these loans. See Note 6 Purchased
Loans for additional information. For revolving home equity
loans and commercial credit lines, this fair value does not
include any amount for new loans or the related fees that will
be generated from the existing customer relationships.
Nonaccrual loans are valued at their estimated recovery value.
Also refer to the Fair Value Measurement and Fair Value
Option sections of this Note 9 regarding the fair value of
commercial and residential mortgage loans held for sale.
Loans are presented net of the ALLL and do not include future
accretable discounts related to purchased impaired loans.
O
THER
A
SSETS
Other assets as shown in the preceding table includes the
following:
• FHLB and FRB stock,
• equity investments carried at cost and fair value, and
• BlackRock Series C Preferred Stock.
Refer to the Fair Value Measurement section of this Note 9
regarding the fair value of other assets and liabilities which
includes a Rabbi Trust.
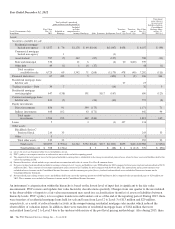
Investments accounted for under the equity method, including
our investment in BlackRock, are not included in the
preceding Table 94.
Refer to the Fair Value Measurement section of this Note 9
regarding the fair value of equity investments.
The aggregate carrying value of our investments that are
carried at cost and FHLB and FRB stock was $1.8 billion at
December 31, 2013 and was $1.7 billion at December 31,
2012, which approximates fair value at each date.
M
ORTGAGE
S
ERVICING
R
IGHTS
Fair value is based on the present value of the estimated future
cash flows, incorporating assumptions as to prepayment rates,
discount rates, default rates, escrow balances, interest rates,
cost to service and other factors.
The key valuation assumptions for commercial and residential
mortgage loan servicing rights at December 31, 2013 and
December 31, 2012 are included in Note 10 Goodwill and
Other Intangible Assets.
C
USTOMER
R
ESALE
A
GREEMENTS
Refer to the Fair Value Measurement section of this Note 9
regarding the fair value of customer resale agreements.
The PNC Financial Services Group, Inc. – Form 10-K 171