PNC Bank 2013 Annual Report Download - page 193
Download and view the complete annual report
Please find page 193 of the 2013 PNC Bank annual report below. You can navigate through the pages in the report by either clicking on the pages listed below, or by using the keyword search tool below to find specific information within the annual report.-
 1
1 -
2
-
3
-
4
-
5
-
6
-
7
-
8
-
9
-
10
-
11
-
12
-
13
-
14
-
15
-
16
-
17
-
18
-
19
-
20
-
21
-
22
-
23
-
24
-
25
-
26
-
27
-
28
-
29
-
30
-
31
-
32
-
33
-
34
-
35
-
36
-
37
-
38
-
39
-
40
-
41
-
42
-
43
-
44
-
45
-
46
-
47
-
48
-
49
-
50
-
51
-
52
-
53
-
54
-
55
-
56
-
57
-
58
-
59
-
60
-
61
-
62
-
63
-
64
-
65
-
66
-
67
-
68
-
69
-
70
-
71
-
72
-
73
-
74
-
75
-
76
-
77
-
78
-
79
-
80
-
81
-
82
-
83
-
84
-
85
-
86
-
87
-
88
-
89
-
90
-
91
-
92
-
93
-
94
-
95
-
96
-
97
-
98
-
99
-
100
-
101
-
102
-
103
-
104
-
105
-
106
-
107
-
108
-
109
-
110
-
111
-
112
-
113
-
114
-
115
-
116
-
117
-
118
-
119
-
120
-
121
-
122
-
123
-
124
-
125
-
126
-
127
-
128
-
129
-
130
-
131
-
132
-
133
-
134
-
135
-
136
-
137
-
138
-
139
-
140
-
141
-
142
-
143
-
144
-
145
-
146
-
147
-
148
-
149
-
150
-
151
-
152
-
153
-
154
-
155
-
156
-
157
-
158
-
159
-
160
-
161
-
162
-
163
-
164
-
165
-
166
-
167
-
168
-
169
-
170
-
171
-
172
-
173
-
174
-
175
-
176
-
177
-
178
-
179
-
180
-
181
-
182
-
 183
183 -
 184
184 -
 185
185 -
 186
186 -
 187
187 -
 188
188 -
 189
189 -
 190
190 -
 191
191 -
 192
192 -
 193
193 -
 194
194 -
 195
195 -
 196
196 -
 197
197 -
 198
198 -
 199
199 -
 200
200 -
 201
201 -
 202
202 -
 203
203 -
204
-
205
-
206
-
207
-
208
-
209
-
210
-
211
-
212
-
213
-
214
-
215
-
216
-
217
-
218
-
219
-
220
-
221
-
222
-
223
-
224
-
225
-
226
-
227
-
228
-
229
-
230
-
231
-
232
-
233
-
234
-
235
-
236
-
237
-
238
-
239
-
240
-
241
-
242
-
243
-
244
-
245
-
246
-
247
-
248
-
249
-
250
-
251
-
252
-
253
-
254
-
255
-
256
-
257
-
258
-
259
-
260
-
261
-
262
-
263
-
264
-
265
-
266
 |
 |

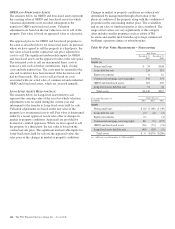
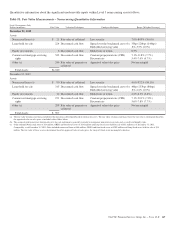
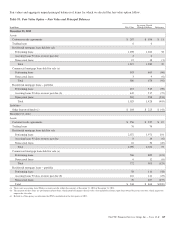
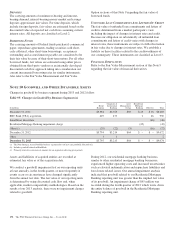
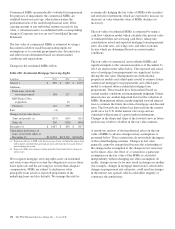
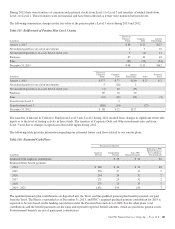
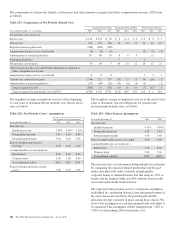
The following tables set forth the fair value of commercial and
residential MSRs and the sensitivity analysis of the
hypothetical effect on the fair value of MSRs to immediate
adverse changes of 10% and 20% in those assumptions:
Table 101: Commercial Mortgage Loan Servicing Rights –
Key Valuation Assumptions
Dollars in millions
December 31
2013
December 31
2012
Fair Value $ 552 $ 427
Weighted-average life (years) 5.3 4.8
Weighted-average constant prepayment
rate 7.52% 7.63%
Decline in fair value from 10%
adverse change $ 12 $ 8
Decline in fair value from 20%
adverse change $ 23 $ 16
Effective discount rate 6.91% 7.70%
Decline in fair value from 10%
adverse change $ 18 $ 12
Decline in fair value from 20%
adverse change $ 35 $ 23
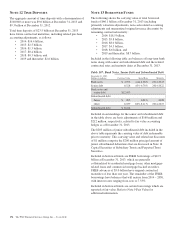
Table 102: Residential Mortgage Loan Servicing Rights –
Key Valuation Assumptions
Dollars in millions
December 31
2013
December 31
2012
Fair value $1,087 $ 650
Weighted-average life (years) 7.9 4.3
Weighted-average constant prepayment
rate 7.61% 18.78%
Decline in fair value from 10%
adverse change $ 47 $ 45
Decline in fair value from 20%
adverse change $ 91 $ 85
Weighted-average option adjusted
spread 10.24% 11.15%
Decline in fair value from 10%
adverse change $ 47 $ 26
Decline in fair value from 20%
adverse change $ 91 $ 49
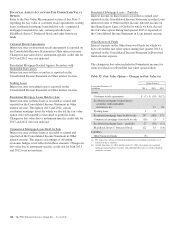
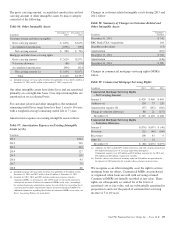
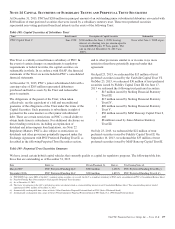
Fees from mortgage and other loan servicing, comprised of
contractually specified servicing fees, late fees and ancillary
fees, follows:
Table 103: Fees from Mortgage and Other Loan Servicing
In millions 2013 2012 2011
Fees from mortgage and other loan servicing $544 $557 $641
We also generate servicing fees from fee-based activities
provided to others for which we do not have an associated
servicing asset.
Fees from commercial MSRs, residential MSRs and other loan
servicing are reported on our Consolidated Income Statement
in the line items Corporate services, Residential mortgage, and
Consumer services, respectively.
N
OTE
11 P
REMISES
,E
QUIPMENT AND
L
EASEHOLD
I
MPROVEMENTS
Premises, equipment and leasehold improvements, stated at
cost less accumulated depreciation and amortization, were as
follows:
Table 104: Premises, Equipment and Leasehold
Improvements
In millions
December 31
2013
December 31
2012
Total Premises, equipment and leasehold
improvements (a) $ 8,903 $ 8,337
Accumulated depreciation and
amortization (3,285) (2,909)
Net book value $ 5,618 $ 5,428
(a) Primarily relates to equipment and buildings.
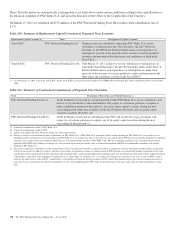
Depreciation expense on premises, equipment and leasehold
improvements and amortization expense, primarily for
capitalized internally developed software, was as follows:
Table 105: Depreciation and Amortization Expense
Year ended December 31
In millions 2013 2012 2011
Continuing operations:
Depreciation $546 $521 $474
Amortization 23 19 22
We lease certain facilities and equipment under agreements
expiring at various dates through the year 2081. We account
for these as operating leases. Rental expense on such leases
was as follows:
Table 106: Lease Rental Expense
Year ended December 31
In millions 2013 2012 2011
Continuing operations: $412 $405 $357
Required minimum annual rentals that we owe on
noncancelable leases having initial or remaining terms in
excess of one year totaled $2.7 billion at December 31, 2013.
Future minimum annual rentals are as follows:
• 2014: $389 million,
• 2015: $339 million,
• 2016: $288 million,
• 2017: $251 million,
• 2018: $221 million, and
• 2019 and thereafter: $1.2 billion.
The PNC Financial Services Group, Inc. – Form 10-K 175