PNC Bank 2013 Annual Report Download - page 209
Download and view the complete annual report
Please find page 209 of the 2013 PNC Bank annual report below. You can navigate through the pages in the report by either clicking on the pages listed below, or by using the keyword search tool below to find specific information within the annual report.-
 1
1 -
2
-
3
-
4
-
5
-
6
-
7
-
8
-
9
-
10
-
11
-
12
-
13
-
14
-
15
-
16
-
17
-
18
-
19
-
20
-
21
-
22
-
23
-
24
-
25
-
26
-
27
-
28
-
29
-
30
-
31
-
32
-
33
-
34
-
35
-
36
-
37
-
38
-
39
-
40
-
41
-
42
-
43
-
44
-
45
-
46
-
47
-
48
-
49
-
50
-
51
-
52
-
53
-
54
-
55
-
56
-
57
-
58
-
59
-
60
-
61
-
62
-
63
-
64
-
65
-
66
-
67
-
68
-
69
-
70
-
71
-
72
-
73
-
74
-
75
-
76
-
77
-
78
-
79
-
80
-
81
-
82
-
83
-
84
-
85
-
86
-
87
-
88
-
89
-
90
-
91
-
92
-
93
-
94
-
95
-
96
-
97
-
98
-
99
-
100
-
101
-
102
-
103
-
104
-
105
-
106
-
107
-
108
-
109
-
110
-
111
-
112
-
113
-
114
-
115
-
116
-
117
-
118
-
119
-
120
-
121
-
122
-
123
-
124
-
125
-
126
-
127
-
128
-
129
-
130
-
131
-
132
-
133
-
134
-
135
-
136
-
137
-
138
-
139
-
140
-
141
-
142
-
143
-
144
-
145
-
146
-
147
-
148
-
149
-
150
-
151
-
152
-
153
-
154
-
155
-
156
-
157
-
158
-
159
-
160
-
161
-
162
-
163
-
164
-
165
-
166
-
167
-
168
-
169
-
170
-
171
-
172
-
173
-
174
-
175
-
176
-
177
-
178
-
179
-
180
-
181
-
182
-
183
-
184
-
185
-
186
-
187
-
188
-
189
-
190
-
191
-
192
-
193
-
194
-
195
-
196
-
197
-
198
-
 199
199 -
 200
200 -
 201
201 -
 202
202 -
 203
203 -
 204
204 -
 205
205 -
 206
206 -
 207
207 -
 208
208 -
 209
209 -
 210
210 -
 211
211 -
 212
212 -
 213
213 -
 214
214 -
 215
215 -
 216
216 -
 217
217 -
 218
218 -
 219
219 -
220
-
221
-
222
-
223
-
224
-
225
-
226
-
227
-
228
-
229
-
230
-
231
-
232
-
233
-
234
-
235
-
236
-
237
-
238
-
239
-
240
-
241
-
242
-
243
-
244
-
245
-
246
-
247
-
248
-
249
-
250
-
251
-
252
-
253
-
254
-
255
-
256
-
257
-
258
-
259
-
260
-
261
-
262
-
263
-
264
-
265
-
266
 |
 |

C
ASH
F
LOW
H
EDGES
We enter into receive-fixed, pay-variable interest rate swaps to
modify the interest rate characteristics of designated
commercial loans from variable to fixed in order to reduce the
impact of changes in future cash flows due to market interest
rate changes. For these cash flow hedges, any changes in the
fair value of the derivatives that are effective in offsetting
changes in the forecasted interest cash flows are recorded in
Accumulated other comprehensive income and are reclassified
to interest income in conjunction with the recognition of
interest received on the loans. In the 12 months that follow
December 31, 2013, we expect to reclassify from the amount
currently reported in Accumulated other comprehensive
income, net derivative gains of $233 million pretax, or $151
million after-tax, in association with interest received on the
hedged loans. This amount could differ from amounts actually
recognized due to changes in interest rates, hedge de-
designations, and the addition of other hedges subsequent to
December 31, 2013. The maximum length of time over which
forecasted loan cash flows are hedged is 10 years. We use
statistical regression analysis to assess the effectiveness of
these hedge relationships at both the inception of the hedge
relationship and on an ongoing basis.
We also periodically enter into forward purchase and sale
contracts to hedge the variability of the consideration that will
be paid or received related to the purchase or sale of
investment securities. The forecasted purchase or sale is
consummated upon gross settlement of the forward contract
itself. As a result, hedge ineffectiveness, if any, is typically
minimal. Gains and losses on these forward contracts are
recorded in Accumulated other comprehensive income and are
recognized in earnings when the hedged cash flows affect
earnings. In the 12 months that follow December 31, 2013, we
expect to reclassify from the amount currently reported in
Accumulated other comprehensive income, net derivative
gains of $13 million pretax, or $8 million after-tax, as
adjustments of yield on investment securities. As of
December 31, 2013 there were no forward purchase or sale
contracts designated in a cash flow hedge relationship.
There were no components of derivative gains or losses
excluded from the assessment of hedge effectiveness related
to either cash flow hedge strategy.
During 2013, 2012, and 2011 there were no gains or losses
from cash flow hedge derivatives reclassified to earnings
because it became probable that the original forecasted
transaction would not occur. The amount of cash flow hedge
ineffectiveness recognized in income for 2013, 2012, and
2011 was not material to PNC’s results of operations.
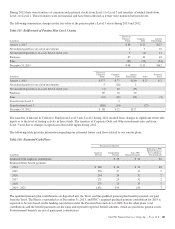
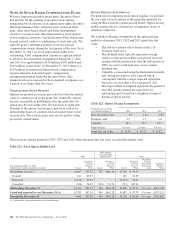
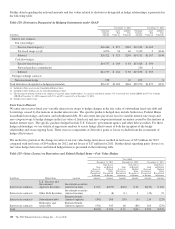
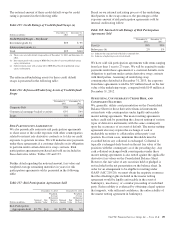
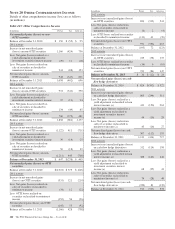
Further detail regarding gains (losses) on derivatives and related cash flows is presented in the following table:
Table 130: Gains (Losses) on Derivatives and Related Cash Flows – Cash Flow Hedges (a) (b)
Year ended December 31
In millions 2013 2012 2011
Gains (Losses) on Derivatives Recognized in OCI – (Effective Portion) $(141) $ 312 $805
Less: Gains (Losses) Reclassified from Accumulated OCI into Income – (Effective Portion)
Interest income 337 456 455
Noninterest income 49 76 43
Total Gains (Losses) Reclassified from Accumulated OCI into Income – (Effective Portion) 386 532 498
Net unrealized gains (losses) on cash flow hedge derivatives $(527) $(220) $307
(a) All cash flow hedge derivatives are interest rate contracts as of December 31, 2013, December 31, 2012 and December 31, 2011.
(b) The amount of cash flow hedge ineffectiveness recognized in income was not material for the periods presented.
N
ET
I
NVESTMENT
H
EDGES
We enter into foreign currency forward contracts to hedge
non-U.S. Dollar (USD) net investments in foreign subsidiaries
against adverse changes in foreign exchange rates. We assess
whether the hedging relationship is highly effective in
achieving offsetting changes in the value of the hedge and
hedged item by qualitatively verifying that the critical terms of
the hedge and hedged item match at the inception of the
hedging relationship and on an ongoing basis. There were no
components of derivative gains or losses excluded from the
assessment of the hedge effectiveness.
For 2013, 2012, and 2011 there was no net investment hedge
ineffectiveness.
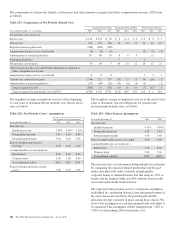
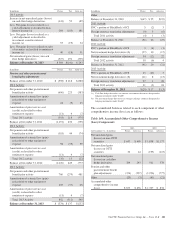
Further detail on gains (losses) on net investment hedge
derivatives is presented in the following table:
Table 131: Gains (Losses) on Derivatives – Net Investment
Hedges (a)
Year ended December 31
In millions 2013 2012
Gains (Losses) on Derivatives Recognized in
OCI (Effective Portion)
Foreign exchange contracts $(21) $(27)
(a) The loss recognized in Accumulated other comprehensive income was less than $1
million as of December 31, 2011.
The PNC Financial Services Group, Inc. – Form 10-K 191