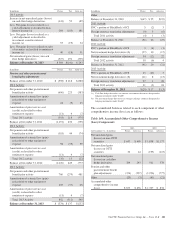
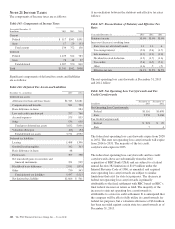
PNC Bank 2013 Annual Report Download - page 210
Download and view the complete annual report
Please find page 210 of the 2013 PNC Bank annual report below. You can navigate through the pages in the report by either clicking on the pages listed below, or by using the keyword search tool below to find specific information within the annual report.-
 1
1 -
2
-
3
-
4
-
5
-
6
-
7
-
8
-
9
-
10
-
11
-
12
-
13
-
14
-
15
-
16
-
17
-
18
-
19
-
20
-
21
-
22
-
23
-
24
-
25
-
26
-
27
-
28
-
29
-
30
-
31
-
32
-
33
-
34
-
35
-
36
-
37
-
38
-
39
-
40
-
41
-
42
-
43
-
44
-
45
-
46
-
47
-
48
-
49
-
50
-
51
-
52
-
53
-
54
-
55
-
56
-
57
-
58
-
59
-
60
-
61
-
62
-
63
-
64
-
65
-
66
-
67
-
68
-
69
-
70
-
71
-
72
-
73
-
74
-
75
-
76
-
77
-
78
-
79
-
80
-
81
-
82
-
83
-
84
-
85
-
86
-
87
-
88
-
89
-
90
-
91
-
92
-
93
-
94
-
95
-
96
-
97
-
98
-
99
-
100
-
101
-
102
-
103
-
104
-
105
-
106
-
107
-
108
-
109
-
110
-
111
-
112
-
113
-
114
-
115
-
116
-
117
-
118
-
119
-
120
-
121
-
122
-
123
-
124
-
125
-
126
-
127
-
128
-
129
-
130
-
131
-
132
-
133
-
134
-
135
-
136
-
137
-
138
-
139
-
140
-
141
-
142
-
143
-
144
-
145
-
146
-
147
-
148
-
149
-
150
-
151
-
152
-
153
-
154
-
155
-
156
-
157
-
158
-
159
-
160
-
161
-
162
-
163
-
164
-
165
-
166
-
167
-
168
-
169
-
170
-
171
-
172
-
173
-
174
-
175
-
176
-
177
-
178
-
179
-
180
-
181
-
182
-
183
-
184
-
185
-
186
-
187
-
188
-
189
-
190
-
191
-
192
-
193
-
194
-
195
-
196
-
197
-
198
-
199
-
 200
200 -
 201
201 -
 202
202 -
 203
203 -
 204
204 -
 205
205 -
 206
206 -
 207
207 -
 208
208 -
 209
209 -
 210
210 -
 211
211 -
 212
212 -
 213
213 -
 214
214 -
 215
215 -
 216
216 -
 217
217 -
 218
218 -
 219
219 -
 220
220 -
221
-
222
-
223
-
224
-
225
-
226
-
227
-
228
-
229
-
230
-
231
-
232
-
233
-
234
-
235
-
236
-
237
-
238
-
239
-
240
-
241
-
242
-
243
-
244
-
245
-
246
-
247
-
248
-
249
-
250
-
251
-
252
-
253
-
254
-
255
-
256
-
257
-
258
-
259
-
260
-
261
-
262
-
263
-
264
-
265
-
266
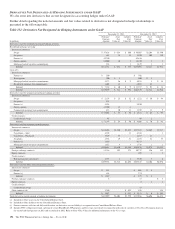
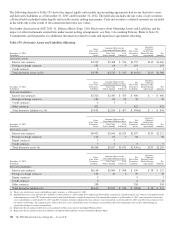
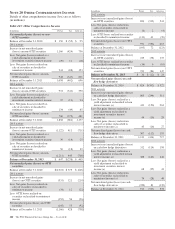
 |
 |

D
ERIVATIVES
N
OT
D
ESIGNATED
A
S
H
EDGING
I
NSTRUMENTS UNDER
GAAP
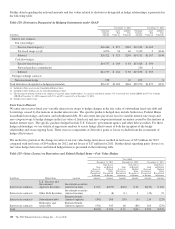
We also enter into derivatives that are not designated as accounting hedges under GAAP.
Further detail regarding the notional amounts and fair values related to derivatives not designated in hedge relationships is
presented in the following table:
Table 132: Derivatives Not Designated As Hedging Instruments under GAAP
December 31, 2013 December 31, 2012
In millions
Notional/
Contract
Amount
Asset
Fair
Value (a)
Liability
Fair
Value (b)
Notional/
Contract
Amount
Asset
Fair
Value (a)
Liability
Fair
Value (b)
Derivatives used for residential mortgage banking activities:
Residential mortgage servicing
Interest rate contracts:
Swaps $ 37,424 $ 654 $ 360 $ 59,607 $2,204 $1,790
Swaptions 845 18 18 5,890 209 119
Futures (c) 49,250 49,816
Futures options 24,000 10 2 34,350 5 2
Mortgage-backed securities commitments 832 3 3,429 3 1
Subtotal $112,351 $ 682 $ 383 $153,092 $2,421 $1,912
Loan sales
Interest rate contracts:
Futures (c) $ 350 $ 702
Bond options 200 $ 1 900 $ 3
Mortgage-backed securities commitments 5,173 26 $ 9 8,033 5 $ 14
Residential mortgage loan commitments 1,605 13 4,092 85
Subtotal $ 7,328 $ 40 $ 9 $ 13,727 $ 93 $ 14
Subtotal $119,679 $ 722 $ 392 $166,819 $2,514 $1,926
Derivatives used for commercial mortgage banking activities
Interest rate contracts:
Swaps $ 2,158 $ 23 $ 52 $ 1,222 $ 56 $ 84
Swaptions 125 3
Futures (c) 4,598 2,030
Futures options 45,500 15 4
Commercial mortgage loan commitments 673 20 11 1,259 12 9
Subtotal $ 53,054 $ 58 $ 70 $ 4,511 $ 68 $ 93
Credit contracts:
Credit default swaps 95 95 2
Subtotal $ 53,149 $ 58 $ 70 $ 4,606 $ 70 $ 93
Derivatives used for customer-related activities:
Interest rate contracts:
Swaps $134,408 $2,540 $2,445 $127,567 $3,869 $3,917
Caps/floors – Sold 4,789 11 4,588 1
Caps/floors – Purchased 5,519 37 4,187 21
Swaptions 2,354 49 51 2,285 82 35
Futures (c) 1,856 9,113
Mortgage-backed securities commitments 1,515 4 3 1,736 2 2
Subtotal $150,441 $2,630 $2,510 $149,476 $3,974 $3,955
Foreign exchange contracts 14,316 192 172 10,737 126 112
Equity contracts 105 1 3
Credit contracts:
Risk participation agreements 4,777 2 4 3,530 5 6
Subtotal $169,534 $2,824 $2,686 $163,848 $4,106 $4,076
Derivatives used for other risk management activities:
Interest rate contracts:
Swaps $ 511 $ 601 $ 4
Futures (c) 838 274
Subtotal $ 1,349 $ 875 $ 4
Foreign exchange contracts 817$3
Equity contracts 822
Credit contracts:
Credit default swaps 15
Other contracts (d) 1,340 $ 422 898 358
Subtotal $ 2,697 $ 422 $ 1,813 $ 6 $ 363
Total derivatives not designated as hedging instruments $345,059 $3,604 $3,570 $337,086 $6,696 $6,458
(a) Included in Other assets on our Consolidated Balance Sheet.
(b) Included in Other liabilities on our Consolidated Balance Sheet.
(c) Futures contracts settle in cash daily and therefore, no derivative asset or liability is recognized on our Consolidated Balance Sheet.
(d) Includes PNC’s obligation to fund a portion of certain BlackRock LTIP programs and the swaps entered into in connection with sales of a portion of Visa Class B common shares in
the second and third quarters of 2013 and second half of 2012. Refer to Note 9 Fair Value for additional information on the Visa swaps.
192 The PNC Financial Services Group, Inc. – Form 10-K