PNC Bank 2013 Annual Report Download - page 162
Download and view the complete annual report
Please find page 162 of the 2013 PNC Bank annual report below. You can navigate through the pages in the report by either clicking on the pages listed below, or by using the keyword search tool below to find specific information within the annual report.-
 1
1 -
2
-
3
-
4
-
5
-
6
-
7
-
8
-
9
-
10
-
11
-
12
-
13
-
14
-
15
-
16
-
17
-
18
-
19
-
20
-
21
-
22
-
23
-
24
-
25
-
26
-
27
-
28
-
29
-
30
-
31
-
32
-
33
-
34
-
35
-
36
-
37
-
38
-
39
-
40
-
41
-
42
-
43
-
44
-
45
-
46
-
47
-
48
-
49
-
50
-
51
-
52
-
53
-
54
-
55
-
56
-
57
-
58
-
59
-
60
-
61
-
62
-
63
-
64
-
65
-
66
-
67
-
68
-
69
-
70
-
71
-
72
-
73
-
74
-
75
-
76
-
77
-
78
-
79
-
80
-
81
-
82
-
83
-
84
-
85
-
86
-
87
-
88
-
89
-
90
-
91
-
92
-
93
-
94
-
95
-
96
-
97
-
98
-
99
-
100
-
101
-
102
-
103
-
104
-
105
-
106
-
107
-
108
-
109
-
110
-
111
-
112
-
113
-
114
-
115
-
116
-
117
-
118
-
119
-
120
-
121
-
122
-
123
-
124
-
125
-
126
-
127
-
128
-
129
-
130
-
131
-
132
-
133
-
134
-
135
-
136
-
137
-
138
-
139
-
140
-
141
-
142
-
143
-
144
-
145
-
146
-
147
-
148
-
149
-
150
-
151
-
 152
152 -
 153
153 -
 154
154 -
 155
155 -
 156
156 -
 157
157 -
 158
158 -
 159
159 -
 160
160 -
 161
161 -
 162
162 -
 163
163 -
 164
164 -
 165
165 -
 166
166 -
 167
167 -
 168
168 -
 169
169 -
 170
170 -
 171
171 -
 172
172 -
173
-
174
-
175
-
176
-
177
-
178
-
179
-
180
-
181
-
182
-
183
-
184
-
185
-
186
-
187
-
188
-
189
-
190
-
191
-
192
-
193
-
194
-
195
-
196
-
197
-
198
-
199
-
200
-
201
-
202
-
203
-
204
-
205
-
206
-
207
-
208
-
209
-
210
-
211
-
212
-
213
-
214
-
215
-
216
-
217
-
218
-
219
-
220
-
221
-
222
-
223
-
224
-
225
-
226
-
227
-
228
-
229
-
230
-
231
-
232
-
233
-
234
-
235
-
236
-
237
-
238
-
239
-
240
-
241
-
242
-
243
-
244
-
245
-
246
-
247
-
248
-
249
-
250
-
251
-
252
-
253
-
254
-
255
-
256
-
257
-
258
-
259
-
260
-
261
-
262
-
263
-
264
-
265
-
266
 |
 |

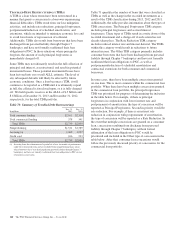
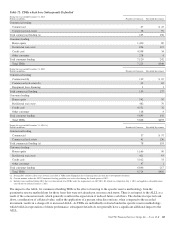
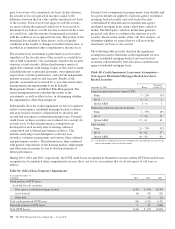
For consumer lending TDRs, except TDRs resulting from borrowers that have been discharged from personal liability through Chapter
7 bankruptcy and have not formally reaffirmed their loan obligations to PNC, the ALLL is calculated using a discounted cash flow
model, which leverages subsequent default, prepayment, and severity rate assumptions based upon historically observed data. Similar
to the commercial lending specific reserve methodology, the reduced expected cash flows resulting from the concessions granted
impact the consumer lending ALLL. The decline in expected cash flows due to the application of a present value discount rate or the
consideration of collateral value, when compared to the recorded investment, results in increased ALLL or a charge-off.
I
MPAIRED
L
OANS
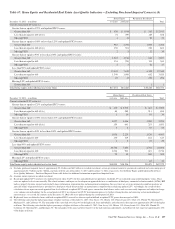
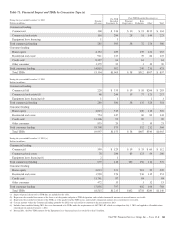
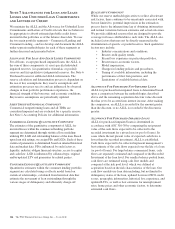
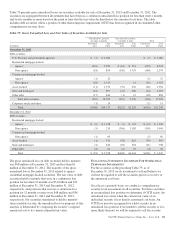
Impaired loans include commercial nonperforming loans and consumer and commercial TDRs, regardless of nonperforming status.
Excluded from impaired loans are nonperforming leases, loans held for sale, loans accounted for under the fair value option,
smaller balance homogeneous type loans and purchased impaired loans. See Note 6 Purchased Loans for additional information.
Nonperforming equipment lease financing loans of $5 million and $12 million at December 31, 2013 and December 31, 2012,
respectively, are excluded from impaired loans pursuant to authoritative lease accounting guidance. We did not recognize any
interest income on impaired loans that have not returned to performing status, while they were impaired during the year ended
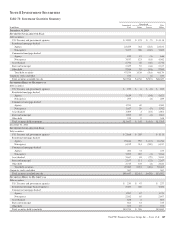
December 31, 2013 and December 31, 2012. The following table provides further detail on impaired loans individually evaluated
for impairment and the associated ALLL. Certain commercial impaired loans and loans to consumers discharged from bankruptcy
and not formally reaffirmed do not have a related ALLL as the valuation of these impaired loans exceeded the recorded investment.
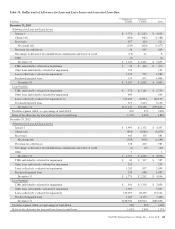
Table 73: Impaired Loans
In millions
Unpaid
Principal
Balance
Recorded
Investment (a)
Associated
Allowance (b)
Average
Recorded
Investment (a)
December 31, 2013
Impaired loans with an associated allowance
Commercial $ 549 $ 400 $ 90 $ 442
Commercial real estate 517 349 89 478
Home equity 999 992 334 900
Residential real estate 573 436 74 645
Credit card 166 166 36 189
Other consumer 71 57 2 68
Total impaired loans with an associated allowance $2,875 $2,400 $625 $2,722
Impaired loans without an associated allowance
Commercial $ 309 $ 163 $ 161
Commercial real estate 421 315 354
Home equity 366 124 166
Residential real estate 415 386 267
Total impaired loans without an associated allowance $1,511 $ 988 $ 948
Total impaired loans $4,386 $3,388 $625 $3,670
December 31, 2012 (c)
Impaired loans with an associated allowance
Commercial $ 824 $ 523 $150 $ 653
Commercial real estate 851 594 143 778
Home equity 1,070 1,013 328 851
Residential real estate 778 663 168 700
Credit card 204 204 48 227
Other consumer 104 86 3 63
Total impaired loans with an associated allowance $3,831 $3,083 $840 $3,272
Impaired loans without an associated allowance
Commercial $ 362 $ 126 $ 157
Commercial real estate 562 355 400
Home equity 169 121 40
Residential real estate 316 231 77
Total impaired loans without an associated allowance $1,409 $ 833 $ 674
Total impaired loans $5,240 $3,916 $840 $3,946
(a) Recorded investment in a loan includes the unpaid principal balance plus accrued interest and net accounting adjustments, less any charge-offs. Recorded investment does not include
any associated valuation allowance. Average recorded investment is for the year ended December 31, 2013 and the year ended December 31, 2012, respectively.
(b) Associated allowance amounts include $.5 billion and $.6 billion for TDRs at December 31, 2013 and December 31, 2012, respectively.
(c) Certain impaired loan balances at December 31, 2012 were reclassified from Impaired loans with an associated allowance to Impaired loans without an associated allowance to reflect
those loans that had been identified as of December 31, 2012 as loans where a borrower has been discharged from personal liability in bankruptcy and has not formally reaffirmed its
loan obligation to PNC and the loans were subsequently charged-off to collateral value less costs to sell. This presentation is consistent with updated processes in effect as of
March 31, 2013.
144 The PNC Financial Services Group, Inc. – Form 10-K