PNC Bank 2013 Annual Report Download - page 127
Download and view the complete annual report
Please find page 127 of the 2013 PNC Bank annual report below. You can navigate through the pages in the report by either clicking on the pages listed below, or by using the keyword search tool below to find specific information within the annual report.-
 1
1 -
2
-
3
-
4
-
5
-
6
-
7
-
8
-
9
-
10
-
11
-
12
-
13
-
14
-
15
-
16
-
17
-
18
-
19
-
20
-
21
-
22
-
23
-
24
-
25
-
26
-
27
-
28
-
29
-
30
-
31
-
32
-
33
-
34
-
35
-
36
-
37
-
38
-
39
-
40
-
41
-
42
-
43
-
44
-
45
-
46
-
47
-
48
-
49
-
50
-
51
-
52
-
53
-
54
-
55
-
56
-
57
-
58
-
59
-
60
-
61
-
62
-
63
-
64
-
65
-
66
-
67
-
68
-
69
-
70
-
71
-
72
-
73
-
74
-
75
-
76
-
77
-
78
-
79
-
80
-
81
-
82
-
83
-
84
-
85
-
86
-
87
-
88
-
89
-
90
-
91
-
92
-
93
-
94
-
95
-
96
-
97
-
98
-
99
-
100
-
101
-
102
-
103
-
104
-
105
-
106
-
107
-
108
-
109
-
110
-
111
-
112
-
113
-
114
-
115
-
116
-
 117
117 -
 118
118 -
 119
119 -
 120
120 -
 121
121 -
 122
122 -
 123
123 -
 124
124 -
 125
125 -
 126
126 -
 127
127 -
 128
128 -
 129
129 -
 130
130 -
 131
131 -
 132
132 -
 133
133 -
 134
134 -
 135
135 -
 136
136 -
 137
137 -
138
-
139
-
140
-
141
-
142
-
143
-
144
-
145
-
146
-
147
-
148
-
149
-
150
-
151
-
152
-
153
-
154
-
155
-
156
-
157
-
158
-
159
-
160
-
161
-
162
-
163
-
164
-
165
-
166
-
167
-
168
-
169
-
170
-
171
-
172
-
173
-
174
-
175
-
176
-
177
-
178
-
179
-
180
-
181
-
182
-
183
-
184
-
185
-
186
-
187
-
188
-
189
-
190
-
191
-
192
-
193
-
194
-
195
-
196
-
197
-
198
-
199
-
200
-
201
-
202
-
203
-
204
-
205
-
206
-
207
-
208
-
209
-
210
-
211
-
212
-
213
-
214
-
215
-
216
-
217
-
218
-
219
-
220
-
221
-
222
-
223
-
224
-
225
-
226
-
227
-
228
-
229
-
230
-
231
-
232
-
233
-
234
-
235
-
236
-
237
-
238
-
239
-
240
-
241
-
242
-
243
-
244
-
245
-
246
-
247
-
248
-
249
-
250
-
251
-
252
-
253
-
254
-
255
-
256
-
257
-
258
-
259
-
260
-
261
-
262
-
263
-
264
-
265
-
266
 |
 |

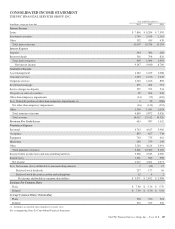
CONSOLIDATED BALANCE SHEET
THE PNC FINANCIAL SERVICES GROUP, INC.
In millions, except par value
December 31
2013
December 31
2012
Assets
Cash and due from banks (includes $5 and $4 for VIEs) (a) $ 4,043 $ 5,220
Federal funds sold and resale agreements (includes $207 and $256 measured at fair value) (b) 1,986 1,463
Trading securities 3,073 2,096
Interest-earning deposits with banks (includes $7 and $6 for VIEs) (a) 12,135 3,984
Loans held for sale (includes $1,901 and $2,868 measured at fair value) (b) 2,255 3,693
Investment securities (includes $0 and $9 for VIEs) (a) 60,294 61,406
Loans (includes $1,736 and $7,781 for VIEs) (a) (includes $1,025 and $244 measured at fair value) (b) 195,613 185,856
Allowance for loan and lease losses (includes $(58) and $(75) for VIEs) (a) (3,609) (4,036)
Net loans 192,004 181,820
Goodwill 9,074 9,072
Other intangible assets 2,216 1,797
Equity investments (includes $582 and $1,429 for VIEs) (a) 10,664 10,877
Other (includes $591 and $1,281 for VIEs) (a) (includes $338 and $319 measured at fair value) (b) 22,552 23,679
Total assets $320,296 $305,107
Liabilities
Deposits
Noninterest-bearing $ 70,306 $ 69,980
Interest-bearing 150,625 143,162
Total deposits 220,931 213,142
Borrowed funds
Federal funds purchased and repurchase agreements 4,289 3,327
Federal Home Loan Bank borrowings 12,912 9,437
Bank notes and senior debt 12,603 10,429
Subordinated debt 8,244 7,299
Commercial paper (includes $0 and $6,045 for VIEs) (a) 4,997 8,453
Other (includes $414 and $257 for VIEs) (a) (includes $184 and $0 measured at fair value) (b) 3,060 1,962
Total borrowed funds 46,105 40,907
Allowance for unfunded loan commitments and letters of credit 242 250
Accrued expenses (includes $83 and $132 for VIEs) (a) 4,734 4,449
Other (includes $252 and $976 for VIEs) (a) 4,187 4,594
Total liabilities 276,199 263,342
Equity
Preferred stock (c)
Common stock ($5 par value, authorized 800 shares, issued 540 and 538 shares) 2,698 2,690
Capital surplus – preferred stock 3,941 3,590
Capital surplus – common stock and other 12,416 12,193
Retained earnings 23,325 20,265
Accumulated other comprehensive income 436 834
Common stock held in treasury at cost: 7 and 10 shares (408) (569)
Total shareholders’ equity 42,408 39,003
Noncontrolling interests 1,689 2,762
Total equity 44,097 41,765
Total liabilities and equity $320,296 $305,107
(a) Amounts represent the assets or liabilities of consolidated variable interest entities (VIEs).
(b) Amounts represent items for which we have elected the fair value option.
(c) Par value less than $.5 million at each date.
See accompanying Notes To Consolidated Financial Statements.
The PNC Financial Services Group, Inc. – Form 10-K 109