PNC Bank 2013 Annual Report Download - page 155
Download and view the complete annual report
Please find page 155 of the 2013 PNC Bank annual report below. You can navigate through the pages in the report by either clicking on the pages listed below, or by using the keyword search tool below to find specific information within the annual report.-
 1
1 -
2
-
3
-
4
-
5
-
6
-
7
-
8
-
9
-
10
-
11
-
12
-
13
-
14
-
15
-
16
-
17
-
18
-
19
-
20
-
21
-
22
-
23
-
24
-
25
-
26
-
27
-
28
-
29
-
30
-
31
-
32
-
33
-
34
-
35
-
36
-
37
-
38
-
39
-
40
-
41
-
42
-
43
-
44
-
45
-
46
-
47
-
48
-
49
-
50
-
51
-
52
-
53
-
54
-
55
-
56
-
57
-
58
-
59
-
60
-
61
-
62
-
63
-
64
-
65
-
66
-
67
-
68
-
69
-
70
-
71
-
72
-
73
-
74
-
75
-
76
-
77
-
78
-
79
-
80
-
81
-
82
-
83
-
84
-
85
-
86
-
87
-
88
-
89
-
90
-
91
-
92
-
93
-
94
-
95
-
96
-
97
-
98
-
99
-
100
-
101
-
102
-
103
-
104
-
105
-
106
-
107
-
108
-
109
-
110
-
111
-
112
-
113
-
114
-
115
-
116
-
117
-
118
-
119
-
120
-
121
-
122
-
123
-
124
-
125
-
126
-
127
-
128
-
129
-
130
-
131
-
132
-
133
-
134
-
135
-
136
-
137
-
138
-
139
-
140
-
141
-
142
-
143
-
144
-
 145
145 -
 146
146 -
 147
147 -
 148
148 -
 149
149 -
 150
150 -
 151
151 -
 152
152 -
 153
153 -
 154
154 -
 155
155 -
 156
156 -
 157
157 -
 158
158 -
 159
159 -
 160
160 -
 161
161 -
 162
162 -
 163
163 -
 164
164 -
 165
165 -
166
-
167
-
168
-
169
-
170
-
171
-
172
-
173
-
174
-
175
-
176
-
177
-
178
-
179
-
180
-
181
-
182
-
183
-
184
-
185
-
186
-
187
-
188
-
189
-
190
-
191
-
192
-
193
-
194
-
195
-
196
-
197
-
198
-
199
-
200
-
201
-
202
-
203
-
204
-
205
-
206
-
207
-
208
-
209
-
210
-
211
-
212
-
213
-
214
-
215
-
216
-
217
-
218
-
219
-
220
-
221
-
222
-
223
-
224
-
225
-
226
-
227
-
228
-
229
-
230
-
231
-
232
-
233
-
234
-
235
-
236
-
237
-
238
-
239
-
240
-
241
-
242
-
243
-
244
-
245
-
246
-
247
-
248
-
249
-
250
-
251
-
252
-
253
-
254
-
255
-
256
-
257
-
258
-
259
-
260
-
261
-
262
-
263
-
264
-
265
-
266
 |
 |

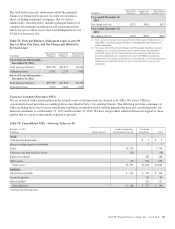
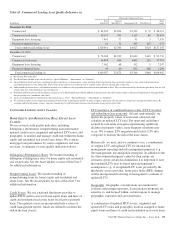
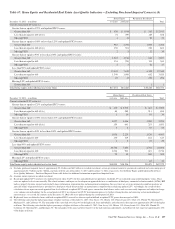
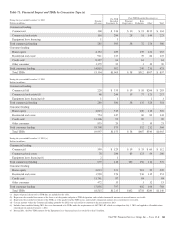
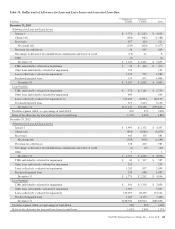
Table 67: Home Equity and Residential Real Estate Asset Quality Indicators – Excluding Purchased Impaired Loans (a) (b)
Home Equity Residential Real Estate
December 31, 2013 – in millions 1st Liens 2nd Liens Total
Current estimated LTV ratios (c)
Greater than or equal to 125% and updated FICO scores:
Greater than 660 $ 438 $ 1,914 $ 563 $ 2,915
Less than or equal to 660 (d) (e) 74 399 185 658
Missing FICO 111 20 32
Greater than or equal to 100% to less than 125% and updated FICO scores:
Greater than 660 987 2,794 1,005 4,786
Less than or equal to 660 (d) (e) 150 501 210 861
Missing FICO 2 5 32 39
Greater than or equal to 90% to less than 100% and updated FICO scores:
Greater than 660 1,047 1,916 844 3,807
Less than or equal to 660 134 298 131 563
Missing FICO 2 3 22 27
Less than 90% and updated FICO scores:
Greater than 660 13,445 7,615 6,309 27,369
Less than or equal to 660 1,349 1,009 662 3,020
Missing FICO 25 17 256 298
Missing LTV and updated FICO scores:
Greater than 660 11
Total home equity and residential real estate loans $17,654 $16,482 $10,240 $44,376
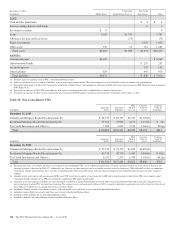
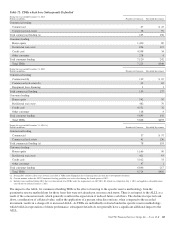
Home Equity Residential Real Estate
TotalDecember 31, 2012 – in millions 1st Liens 2nd Liens
Current estimated LTV ratios (c)
Greater than or equal to 125% and updated FICO scores:
Greater than 660 $ 470 $ 2,772 $ 667 $ 3,909
Less than or equal to 660 (d) (e) 84 589 211 884
Missing FICO 110 19 30
Greater than or equal to 100% to less than 125% and updated FICO scores:
Greater than 660 1,027 3,636 1,290 5,953
Less than or equal to 660 (d) (e) 159 641 253 1,053
Missing FICO 3 6 45 54
Greater than or equal to 90% to less than 100% and updated FICO scores:
Greater than 660 1,056 2,229 1,120 4,405
Less than or equal to 660 130 319 164 613
Missing FICO 1 5 23 29
Less than 90% and updated FICO scores:
Greater than 660 10,736 7,255 4,701 22,692
Less than or equal to 660 1,214 921 621 2,756
Missing FICO 23 13 269 305
Missing LTV and updated FICO scores:
Missing FICO 42 42
Total home equity and residential real estate loans $14,904 $18,396 $9,425 $42,725
(a) Excludes purchased impaired loans of approximately $5.4 billion and $6.2 billion in recorded investment, certain government insured or guaranteed residential real estate mortgages of
approximately $1.7 billion and $2.3 billion, and loans held for sale at December 31, 2013 and December 31, 2012, respectively. See the Home Equity and Residential Real Estate
Asset Quality Indicators – Purchased Impaired Loans table below for additional information on purchased impaired loans.
(b) Amounts shown represent recorded investment.
(c) Based upon updated LTV (inclusive of combined loan-to-value (CLTV) for first and subordinate lien positions). Updated LTV are estimated using modeled property values. These
ratios are updated at least semi-annually. The related estimates and inputs are based upon an approach that uses a combination of third-party automated valuation models (AVMs), HPI
indices, property location, internal and external balance information, origination data and management assumptions. In cases where we are in an originated second lien position, we
generally utilize origination balances provided by a third-party which do not include an amortization assumption when calculating updated LTV. Accordingly, the results of these
calculations do not represent actual appraised loan level collateral or updated LTV based upon a current first lien balance, and as such, are necessarily imprecise and subject to change
as we enhance our methodology. In the second quarter of 2013, we enhanced our CLTV determination process by further refining the data and correcting certain methodological
inconsistencies. As a result, the amounts in the December 31, 2012 table were updated during the second quarter of 2013.
(d) Higher risk loans are defined as loans with both an updated FICO score of less than or equal to 660 and an updated LTV greater than or equal to 100%.
(e) The following states had the highest percentage of higher risk loans at December 31, 2013: New Jersey 13%, Illinois 12%, Pennsylvania 12%, Ohio 11%, Florida 9%, Maryland 5%,
Michigan 5%, and California 4%. The remainder of the states had lower than 4% of the higher risk loans individually, and collectively they represent approximately 29% of the higher
risk loans. The following states had the highest percentage of higher risk loans at December 31, 2012: New Jersey 14%, Illinois 11%, Pennsylvania 11%, Ohio 10%, Florida 9%,
California 6%, Maryland 6%, and Michigan 5%. The remainder of the states had lower than 4% of the high risk loans individually, and collectively they represent approximately 28%
of the higher risk loans.
The PNC Financial Services Group, Inc. – Form 10-K 137