PNC Bank 2013 Annual Report Download - page 2
Download and view the complete annual report
Please find page 2 of the 2013 PNC Bank annual report below. You can navigate through the pages in the report by either clicking on the pages listed below, or by using the keyword search tool below to find specific information within the annual report.-
 1
1 -
 2
2 -
 3
3 -
 4
4 -
 5
5 -
 6
6 -
 7
7 -
 8
8 -
 9
9 -
 10
10 -
 11
11 -
 12
12 -
 13
13 -
14
-
15
-
16
-
17
-
18
-
19
-
20
-
21
-
22
-
23
-
24
-
25
-
26
-
27
-
28
-
29
-
30
-
31
-
32
-
33
-
34
-
35
-
36
-
37
-
38
-
39
-
40
-
41
-
42
-
43
-
44
-
45
-
46
-
47
-
48
-
49
-
50
-
51
-
52
-
53
-
54
-
55
-
56
-
57
-
58
-
59
-
60
-
61
-
62
-
63
-
64
-
65
-
66
-
67
-
68
-
69
-
70
-
71
-
72
-
73
-
74
-
75
-
76
-
77
-
78
-
79
-
80
-
81
-
82
-
83
-
84
-
85
-
86
-
87
-
88
-
89
-
90
-
91
-
92
-
93
-
94
-
95
-
96
-
97
-
98
-
99
-
100
-
101
-
102
-
103
-
104
-
105
-
106
-
107
-
108
-
109
-
110
-
111
-
112
-
113
-
114
-
115
-
116
-
117
-
118
-
119
-
120
-
121
-
122
-
123
-
124
-
125
-
126
-
127
-
128
-
129
-
130
-
131
-
132
-
133
-
134
-
135
-
136
-
137
-
138
-
139
-
140
-
141
-
142
-
143
-
144
-
145
-
146
-
147
-
148
-
149
-
150
-
151
-
152
-
153
-
154
-
155
-
156
-
157
-
158
-
159
-
160
-
161
-
162
-
163
-
164
-
165
-
166
-
167
-
168
-
169
-
170
-
171
-
172
-
173
-
174
-
175
-
176
-
177
-
178
-
179
-
180
-
181
-
182
-
183
-
184
-
185
-
186
-
187
-
188
-
189
-
190
-
191
-
192
-
193
-
194
-
195
-
196
-
197
-
198
-
199
-
200
-
201
-
202
-
203
-
204
-
205
-
206
-
207
-
208
-
209
-
210
-
211
-
212
-
213
-
214
-
215
-
216
-
217
-
218
-
219
-
220
-
221
-
222
-
223
-
224
-
225
-
226
-
227
-
228
-
229
-
230
-
231
-
232
-
233
-
234
-
235
-
236
-
237
-
238
-
239
-
240
-
241
-
242
-
243
-
244
-
245
-
246
-
247
-
248
-
249
-
250
-
251
-
252
-
253
-
254
-
255
-
256
-
257
-
258
-
259
-
260
-
261
-
262
-
263
-
264
-
265
-
266
 |
 |

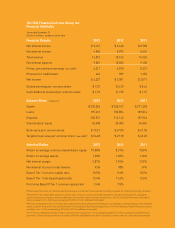
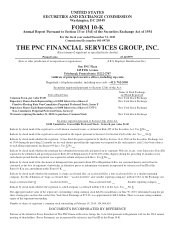
The PNC Financial Services Group, Inc.
Financial Highlights
Year ended December 31
Dollars in millions, except per share data
Financial Results 2013 2012 2011
Net interest income $ 9,147 $ 9,640 $ 8,700
Noninterest income 6,865 5,872 5,626
Total revenue 16,012 15,512 14,326
Noninterest expense 9,801 10,582 9,105
Pretax, pre-provision earnings (non-GAAP) 6,211 4,930 5,221
Provision for credit losses 643 987 1,152
Net income $ 4,227 $ 3,001 $ 3,071
Diluted earnings per common share $ 7.39 $ 5.30 $ 5.64
Cash dividends declared per common share $ 1.72 $ 1.55 $ 1.15
Balance Sheet At year end 2013 2012 2011
Assets $ 320,296 $ 305,107 $ 271,205
Loans 195,613 185,856 159,014
Deposits 220,931 213,142 187,966
Shareholders’ equity 42,408 39,003 34,053
Book value per common share $ 72.21 $ 67.05 $ 61.52
Tangible book value per common share (non-GAAP) $ 54.68 $ 49.18 $ 45.20
Selected Ratios 2013 2012 2011
Return on average common shareholders’ equity 10.88% 8.31% 9.56%
Return on average assets 1.38% 1.02% 1.16%
Net interest margin 3.57% 3.94% 3.92%
Noninterest income to total revenue 43% 38% 39%
Basel I Tier 1 common capital ratio 10.5% 9.6% 10.3%
Basel I Tier 1 risk-based capital ratio 12.4% 11.6% 12.6%
Pro forma Basel III Tier 1 common capital ratio 9.4% 7.5%
PNC believes that pretax, pre-provision earnings serves as a useful tool to help evaluate the ability to provide for credit costs through operations.
PNC believes that tangible book value per common share serves as a useful tool to help evaluate the strength and discipline of a company’s
capital management strategies and as an additional, conservative measure of total company value. See the Statistical Information (Unaudited)
section included in Item 8 of the accompanying 2013 Form 10-K for additional information.
PNC’s pro forma Basel III Tier 1 common capital ratio was estimated without benefit of phase-ins and based on estimated Basel III risk-weighted
assets, using the lower of the ratio calculated under the standardized and advanced approaches. See the Funding and Capital Resources section
included in Item 7 of the accompanying 2013 Form 10-K for additional information.
These Financial Highlights should be read in conjunction with disclosures in the accompanying 2013 Form 10-K including the audited financial
statements. Certain prior period amounts included in the Financial Highlights have been reclassified to conform with the current period presentation.