PNC Bank 2013 Annual Report Download - page 96
Download and view the complete annual report
Please find page 96 of the 2013 PNC Bank annual report below. You can navigate through the pages in the report by either clicking on the pages listed below, or by using the keyword search tool below to find specific information within the annual report.-
 1
1 -
2
-
3
-
4
-
5
-
6
-
7
-
8
-
9
-
10
-
11
-
12
-
13
-
14
-
15
-
16
-
17
-
18
-
19
-
20
-
21
-
22
-
23
-
24
-
25
-
26
-
27
-
28
-
29
-
30
-
31
-
32
-
33
-
34
-
35
-
36
-
37
-
38
-
39
-
40
-
41
-
42
-
43
-
44
-
45
-
46
-
47
-
48
-
49
-
50
-
51
-
52
-
53
-
54
-
55
-
56
-
57
-
58
-
59
-
60
-
61
-
62
-
63
-
64
-
65
-
66
-
67
-
68
-
69
-
70
-
71
-
72
-
73
-
74
-
75
-
76
-
77
-
78
-
79
-
80
-
81
-
82
-
83
-
84
-
85
-
 86
86 -
 87
87 -
 88
88 -
 89
89 -
 90
90 -
 91
91 -
 92
92 -
 93
93 -
 94
94 -
 95
95 -
 96
96 -
 97
97 -
 98
98 -
 99
99 -
 100
100 -
 101
101 -
 102
102 -
 103
103 -
 104
104 -
 105
105 -
 106
106 -
107
-
108
-
109
-
110
-
111
-
112
-
113
-
114
-
115
-
116
-
117
-
118
-
119
-
120
-
121
-
122
-
123
-
124
-
125
-
126
-
127
-
128
-
129
-
130
-
131
-
132
-
133
-
134
-
135
-
136
-
137
-
138
-
139
-
140
-
141
-
142
-
143
-
144
-
145
-
146
-
147
-
148
-
149
-
150
-
151
-
152
-
153
-
154
-
155
-
156
-
157
-
158
-
159
-
160
-
161
-
162
-
163
-
164
-
165
-
166
-
167
-
168
-
169
-
170
-
171
-
172
-
173
-
174
-
175
-
176
-
177
-
178
-
179
-
180
-
181
-
182
-
183
-
184
-
185
-
186
-
187
-
188
-
189
-
190
-
191
-
192
-
193
-
194
-
195
-
196
-
197
-
198
-
199
-
200
-
201
-
202
-
203
-
204
-
205
-
206
-
207
-
208
-
209
-
210
-
211
-
212
-
213
-
214
-
215
-
216
-
217
-
218
-
219
-
220
-
221
-
222
-
223
-
224
-
225
-
226
-
227
-
228
-
229
-
230
-
231
-
232
-
233
-
234
-
235
-
236
-
237
-
238
-
239
-
240
-
241
-
242
-
243
-
244
-
245
-
246
-
247
-
248
-
249
-
250
-
251
-
252
-
253
-
254
-
255
-
256
-
257
-
258
-
259
-
260
-
261
-
262
-
263
-
264
-
265
-
266
 |
 |

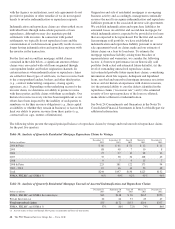
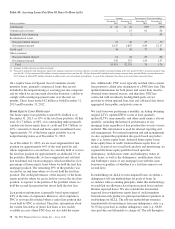
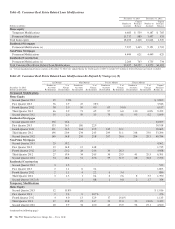
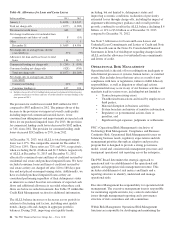
Table 40: Accruing Loans Past Due 90 Days Or More (a)(b)
Amount Percentage of Total Outstandings
Dollars in millions
December 31
2013
December 31
2012
December 31
2013
December 31
2012
Commercial $ 42 $ 42 .05% .05%
Commercial real estate 2 15 .01 .08
Equipment lease financing 2 .03
Residential real estate
Non government insured 35 46 .23 .30
Government insured 1,025 1,855 6.80 12.17
Credit card 34 36 .77 .84
Other consumer
Non government insured 14 18 .06 .08
Government insured 339 337 1.50 1.57
Total $1,491 $2,351 .76 1.26
(a) Amounts in table represent recorded investment.
(b) Pursuant to alignment with interagency supervisory guidance on practices for loans and lines of credit related to consumer lending in the first quarter of 2013, accruing consumer loans
past due 30 – 59 days decreased $44 million, accruing consumer loans past due 60 – 89 days decreased $36 million and accruing consumer loans past due 90 days or more decreased
$315 million, of which $295 million related to residential real estate government insured loans. As part of this alignment, these loans were moved into nonaccrual status.
On a regular basis our Special Asset Committee closely
monitors loans, primarily commercial loans, that are not
included in the nonperforming or accruing past due categories
and for which we are uncertain about the borrower’s ability to
comply with existing repayment terms over the next six
months. These loans totaled $.2 billion at both December 31,
2013 and December 31, 2012.
H
OME
E
QUITY
L
OAN
P
ORTFOLIO
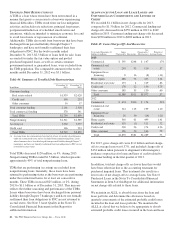
Our home equity loan portfolio totaled $36.4 billion as of
December 31, 2013, or 19% of the total loan portfolio. Of that
total, $21.7 billion, or 60%, was outstanding under primarily
variable-rate home equity lines of credit and $14.7 billion, or
40%, consisted of closed-end home equity installment loans.
Approximately 3% of the home equity portfolio was on
nonperforming status as of December 31, 2013.
As of December 31, 2013, we are in an originated first lien
position for approximately 49% of the total portfolio and,
where originated as a second lien, we currently hold or service
the first lien position for approximately an additional 2% of
the portfolio. Historically, we have originated and sold first
lien residential real estate mortgages, which resulted in a low
percentage of home equity loans where we hold the first lien
mortgage position. The remaining 49% of the portfolio was
secured by second liens where we do not hold the first lien
position. The credit performance of the majority of the home
equity portfolio where we are in, hold or service the first lien
position, is superior to the portion of the portfolio where we
hold the second lien position but do not hold the first lien.
Lien position information is generally based upon original
LTV at the time of origination. However, after origination
PNC is not typically notified when a senior lien position that
is not held by PNC is satisfied. Therefore, information about
the current lien status of junior lien loans is less readily
available in cases where PNC does not also hold the senior
lien. Additionally, PNC is not typically notified when a junior
lien position is added after origination of a PNC first lien. This
updated information for both junior and senior liens must be
obtained from external sources, and therefore, PNC has
contracted with an industry leading third-party service
provider to obtain updated loan, lien and collateral data that is
aggregated from public and private sources.
We track borrower performance monthly, including obtaining
original LTVs, updated FICO scores at least quarterly,
updated LTVs semi-annually, and other credit metrics at least
quarterly, including the historical performance of any
mortgage loans regardless of lien position that we may or may
not hold. This information is used for internal reporting and
risk management. For internal reporting and risk management
we also segment the population into pools based on product
type (e.g., home equity loans, brokered home equity loans,
home equity lines of credit, brokered home equity lines of
credit). As part of our overall risk analysis and monitoring, we
segment the home equity portfolio based upon the
delinquency, modification status and bankruptcy status of
these loans, as well as the delinquency, modification status
and bankruptcy status of any mortgage loan with the same
borrower (regardless of whether it is a first lien senior to our
second lien).
In establishing our ALLL for non-impaired loans, we utilize a
delinquency roll-rate methodology for pools of loans. In
accordance with accounting principles, under this methodology,
we establish our allowance based upon incurred losses and not
lifetime expected losses. We also consider the incremental
expected losses when home equity lines of credit transition
from interest-only products to principal and interest products in
establishing our ALLL. The roll-rate methodology estimates
transition/roll of loan balances from one delinquency state (e.g.,
30-59 days past due) to another delinquency state (e.g., 60-89
days past due) and ultimately to charge-off. The roll through to
78 The PNC Financial Services Group, Inc. – Form 10-K