PNC Bank 2013 Annual Report Download - page 76
Download and view the complete annual report
Please find page 76 of the 2013 PNC Bank annual report below. You can navigate through the pages in the report by either clicking on the pages listed below, or by using the keyword search tool below to find specific information within the annual report.-
 1
1 -
2
-
3
-
4
-
5
-
6
-
7
-
8
-
9
-
10
-
11
-
12
-
13
-
14
-
15
-
16
-
17
-
18
-
19
-
20
-
21
-
22
-
23
-
24
-
25
-
26
-
27
-
28
-
29
-
30
-
31
-
32
-
33
-
34
-
35
-
36
-
37
-
38
-
39
-
40
-
41
-
42
-
43
-
44
-
45
-
46
-
47
-
48
-
49
-
50
-
51
-
52
-
53
-
54
-
55
-
56
-
57
-
58
-
59
-
60
-
61
-
62
-
63
-
64
-
65
-
 66
66 -
 67
67 -
 68
68 -
 69
69 -
 70
70 -
 71
71 -
 72
72 -
 73
73 -
 74
74 -
 75
75 -
 76
76 -
 77
77 -
 78
78 -
 79
79 -
 80
80 -
 81
81 -
 82
82 -
 83
83 -
 84
84 -
 85
85 -
 86
86 -
87
-
88
-
89
-
90
-
91
-
92
-
93
-
94
-
95
-
96
-
97
-
98
-
99
-
100
-
101
-
102
-
103
-
104
-
105
-
106
-
107
-
108
-
109
-
110
-
111
-
112
-
113
-
114
-
115
-
116
-
117
-
118
-
119
-
120
-
121
-
122
-
123
-
124
-
125
-
126
-
127
-
128
-
129
-
130
-
131
-
132
-
133
-
134
-
135
-
136
-
137
-
138
-
139
-
140
-
141
-
142
-
143
-
144
-
145
-
146
-
147
-
148
-
149
-
150
-
151
-
152
-
153
-
154
-
155
-
156
-
157
-
158
-
159
-
160
-
161
-
162
-
163
-
164
-
165
-
166
-
167
-
168
-
169
-
170
-
171
-
172
-
173
-
174
-
175
-
176
-
177
-
178
-
179
-
180
-
181
-
182
-
183
-
184
-
185
-
186
-
187
-
188
-
189
-
190
-
191
-
192
-
193
-
194
-
195
-
196
-
197
-
198
-
199
-
200
-
201
-
202
-
203
-
204
-
205
-
206
-
207
-
208
-
209
-
210
-
211
-
212
-
213
-
214
-
215
-
216
-
217
-
218
-
219
-
220
-
221
-
222
-
223
-
224
-
225
-
226
-
227
-
228
-
229
-
230
-
231
-
232
-
233
-
234
-
235
-
236
-
237
-
238
-
239
-
240
-
241
-
242
-
243
-
244
-
245
-
246
-
247
-
248
-
249
-
250
-
251
-
252
-
253
-
254
-
255
-
256
-
257
-
258
-
259
-
260
-
261
-
262
-
263
-
264
-
265
-
266
 |
 |

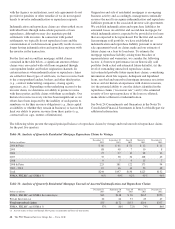
R
ESIDENTIAL
M
ORTGAGE
B
ANKING
(Unaudited)
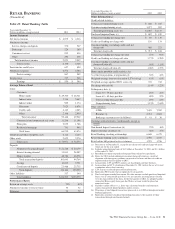
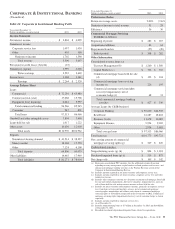
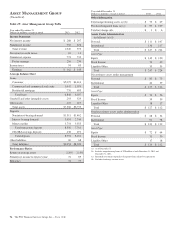
Table 26: Residential Mortgage Banking Table
Year ended December 31
Dollars in millions, except as noted 2013 2012
Income Statement
Net interest income $ 194 $ 209
Noninterest income
Loan servicing revenue
Servicing fees 174 205
Net MSR hedging gains 121 119
Loan sales revenue
Benefit / (Provision) for residential
mortgage repurchase obligations 53 (761)
Loan sales revenue 568 747
Other (10) 7
Total noninterest income 906 317
Total revenue 1,100 526
Provision for credit losses (benefit) 21 (5)
Noninterest expense (a) 845 992
Pretax earnings (loss) 234 (461)
Income taxes (benefit) 86 (153)
Earnings (loss) $ 148 $ (308)
Average Balance Sheet
Portfolio loans $2,376 $ 2,719
Loans held for sale 1,896 1,758
Mortgage servicing rights (MSR) 938 632
Other assets 4,686 6,420
Total assets $9,896 $11,529
Deposits $2,920 $ 2,560
Borrowings and other liabilities 3,142 4,086
Total liabilities $6,062 $ 6,646
Performance Ratios
Return on average assets 1.50% (2.67)%
Noninterest income to total revenue 82 60
Efficiency 77 189
Year ended December 31
Dollars in millions, except as noted 2013 2012
Residential Mortgage Servicing Portfolio –
Serviced for Third Parties (in billions)
Beginning of period $ 119 $ 118
Acquisitions 10 21
Additions 15 14
Repayments/transfers (30) (34)
End of period $ 114 $ 119
Servicing portfolio – third-party
statistics: (b)
Fixed rate 93% 92%
Adjustable rate/balloon 7% 8%
Weighted-average interest rate 4.59% 4.94%
MSR capitalized value (in billions) $ 1.1 $ .7
MSR capitalization value (in basis points) 95 54
Weighted-average servicing fee (in basis
points) 28 28
Residential Mortgage Repurchase Reserve
Beginning of period $ 614 $ 83
(Benefit)/ Provision (53) 761
RBC Bank (USA) acquisition 26
Agency settlements (191)
Losses – loan repurchases (239) (256)
End of Period $ 131 $ 614
Other Information
Loan origination volume (in billions) $15.1 $15.2
Loan sale margin percentage 3.76% 4.92%
Percentage of originations represented by:
Agency and government programs 99% 100%
Purchase volume (c) 30% 23%
Refinance volume 70% 77%
Total nonperforming assets (b) (d) $ 189 $ 134
(a) Includes a goodwill impairment charge of $45 million during the fourth quarter of
2012.
(b) As of December 31.
(c) Mortgages with borrowers as part of residential real estate purchase transactions.
(d) Includes nonperforming loans of $143 million at December 31, 2013 and $90
million at December 31, 2012.
58 The PNC Financial Services Group, Inc. – Form 10-K