PNC Bank 2013 Annual Report Download - page 71
Download and view the complete annual report
Please find page 71 of the 2013 PNC Bank annual report below. You can navigate through the pages in the report by either clicking on the pages listed below, or by using the keyword search tool below to find specific information within the annual report.-
 1
1 -
2
-
3
-
4
-
5
-
6
-
7
-
8
-
9
-
10
-
11
-
12
-
13
-
14
-
15
-
16
-
17
-
18
-
19
-
20
-
21
-
22
-
23
-
24
-
25
-
26
-
27
-
28
-
29
-
30
-
31
-
32
-
33
-
34
-
35
-
36
-
37
-
38
-
39
-
40
-
41
-
42
-
43
-
44
-
45
-
46
-
47
-
48
-
49
-
50
-
51
-
52
-
53
-
54
-
55
-
56
-
57
-
58
-
59
-
60
-
 61
61 -
 62
62 -
 63
63 -
 64
64 -
 65
65 -
 66
66 -
 67
67 -
 68
68 -
 69
69 -
 70
70 -
 71
71 -
 72
72 -
 73
73 -
 74
74 -
 75
75 -
 76
76 -
 77
77 -
 78
78 -
 79
79 -
 80
80 -
 81
81 -
82
-
83
-
84
-
85
-
86
-
87
-
88
-
89
-
90
-
91
-
92
-
93
-
94
-
95
-
96
-
97
-
98
-
99
-
100
-
101
-
102
-
103
-
104
-
105
-
106
-
107
-
108
-
109
-
110
-
111
-
112
-
113
-
114
-
115
-
116
-
117
-
118
-
119
-
120
-
121
-
122
-
123
-
124
-
125
-
126
-
127
-
128
-
129
-
130
-
131
-
132
-
133
-
134
-
135
-
136
-
137
-
138
-
139
-
140
-
141
-
142
-
143
-
144
-
145
-
146
-
147
-
148
-
149
-
150
-
151
-
152
-
153
-
154
-
155
-
156
-
157
-
158
-
159
-
160
-
161
-
162
-
163
-
164
-
165
-
166
-
167
-
168
-
169
-
170
-
171
-
172
-
173
-
174
-
175
-
176
-
177
-
178
-
179
-
180
-
181
-
182
-
183
-
184
-
185
-
186
-
187
-
188
-
189
-
190
-
191
-
192
-
193
-
194
-
195
-
196
-
197
-
198
-
199
-
200
-
201
-
202
-
203
-
204
-
205
-
206
-
207
-
208
-
209
-
210
-
211
-
212
-
213
-
214
-
215
-
216
-
217
-
218
-
219
-
220
-
221
-
222
-
223
-
224
-
225
-
226
-
227
-
228
-
229
-
230
-
231
-
232
-
233
-
234
-
235
-
236
-
237
-
238
-
239
-
240
-
241
-
242
-
243
-
244
-
245
-
246
-
247
-
248
-
249
-
250
-
251
-
252
-
253
-
254
-
255
-
256
-
257
-
258
-
259
-
260
-
261
-
262
-
263
-
264
-
265
-
266
 |
 |

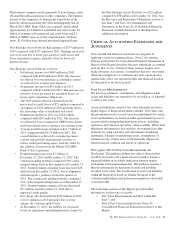
C
ORPORATE
&I
NSTITUTIONAL
B
ANKING
(Unaudited)
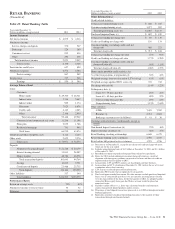
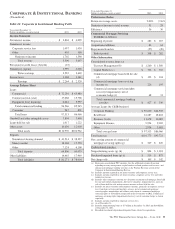
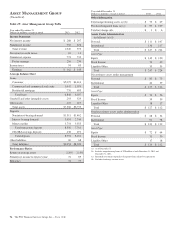
Table 24: Corporate & Institutional Banking Table
Year ended December 31
Dollars in millions, except as noted 2013 2012
Income Statement
Net interest income $ 3,804 $ 4,099
Noninterest income
Corporate service fees 1,097 1,030
Other 605 568
Noninterest income 1,702 1,598
Total revenue 5,506 5,697
Provision for credit losses (benefit) (25)
Noninterest expense 1,999 2,028
Pretax earnings 3,532 3,669
Income taxes 1,268 1,341
Earnings $ 2,264 $ 2,328
Average Balance Sheet
Loans
Commercial $ 72,256 $ 63,480
Commercial real estate 17,668 15,768
Equipment lease financing 6,642 5,997
Total commercial lending 96,566 85,245
Consumer 947 821
Total loans 97,513 86,066
Goodwill and other intangible assets 3,804 3,656
Loans held for sale 1,017 1,222
Other assets 10,636 12,018
Total assets $112,970 $102,962
Deposits
Noninterest-bearing demand $ 41,514 $ 38,337
Money market 18,168 15,590
Other 7,124 6,108
Total deposits 66,806 60,035
Other liabilities 14,465 17,969
Total liabilities $ 81,271 $ 78,004
Year ended December 31
Dollars in millions, except as noted 2013 2012
Performance Ratios
Return on average assets 2.00% 2.26%
Noninterest income to total revenue 31 28
Efficiency 36 36
Commercial Mortgage Servicing
Portfolio (in billions)
Beginning of period $ 282 $ 267
Acquisitions/additions 83 64
Repayments/transfers (57) (49)
End of period $ 308 $ 282
Other Information
Consolidated revenue from: (a)
Treasury Management (b) $ 1,260 $ 1,380
Capital Markets (c) $ 722 $ 710
Commercial mortgage loans held for sale
(d) $ 133 $ 104
Commercial mortgage loan servicing
income (e) 226 195
Commercial mortgage servicing rights
recovery/(impairment), net of
economic hedge (f) 68 31
Total commercial mortgage banking
activities $ 427 $ 330
Average Loans (by C&IB business)
Corporate Banking $ 50,620 $44,945
Real Estate 22,287 18,418
Business Credit 11,678 10,083
Equipment Finance 9,994 9,035
Other 2,934 3,585
Total average loans $ 97,513 $86,066
Total loans (g) $101,773 $93,721
Net carrying amount of commercial
mortgage servicing rights (g) $ 549 $ 420
Credit-related statistics:
Nonperforming assets (g) (h) $ 804 $ 1,181
Purchased impaired loans (g) (i) $ 515 $ 875
Net charge-offs $ 105 $ 142
(a) Represents consolidated PNC amounts. See the additional revenue discussion
regarding treasury management, capital markets-related products and services, and
commercial mortgage banking activities in the Product Revenue section of the
Corporate & Institutional Banking Review.
(b) Includes amounts reported in net interest income and corporate service fees.
(c) Includes amounts reported in net interest income, corporate service fees and other
noninterest income.
(d) Includes other noninterest income for valuations on commercial mortgage loans held
for sale and related commitments, derivative valuations, origination fees, gains on
sale of loans held for sale and net interest income on loans held for sale.
(e) Includes net interest income and noninterest income, primarily in corporate services
fees, from loan servicing and ancillary services, net of commercial mortgage
servicing rights amortization and a direct write-down of commercial mortgage
servicing rights of $24 million recognized in the first quarter of 2012. Commercial
mortgage servicing rights (impairment)/recovery, net of economic hedge is shown
separately.
(f) Includes amounts reported in corporate services fees.
(g) As of December 31.
(h) Includes nonperforming loans of $.7 billion at December 31, 2013 and $1.0 billion
at December 31, 2012.
(i) Recorded investment of purchased impaired loans related to acquisitions.
The PNC Financial Services Group, Inc. – Form 10-K 53