PNC Bank 2013 Annual Report Download - page 190
Download and view the complete annual report
Please find page 190 of the 2013 PNC Bank annual report below. You can navigate through the pages in the report by either clicking on the pages listed below, or by using the keyword search tool below to find specific information within the annual report.-
 1
1 -
2
-
3
-
4
-
5
-
6
-
7
-
8
-
9
-
10
-
11
-
12
-
13
-
14
-
15
-
16
-
17
-
18
-
19
-
20
-
21
-
22
-
23
-
24
-
25
-
26
-
27
-
28
-
29
-
30
-
31
-
32
-
33
-
34
-
35
-
36
-
37
-
38
-
39
-
40
-
41
-
42
-
43
-
44
-
45
-
46
-
47
-
48
-
49
-
50
-
51
-
52
-
53
-
54
-
55
-
56
-
57
-
58
-
59
-
60
-
61
-
62
-
63
-
64
-
65
-
66
-
67
-
68
-
69
-
70
-
71
-
72
-
73
-
74
-
75
-
76
-
77
-
78
-
79
-
80
-
81
-
82
-
83
-
84
-
85
-
86
-
87
-
88
-
89
-
90
-
91
-
92
-
93
-
94
-
95
-
96
-
97
-
98
-
99
-
100
-
101
-
102
-
103
-
104
-
105
-
106
-
107
-
108
-
109
-
110
-
111
-
112
-
113
-
114
-
115
-
116
-
117
-
118
-
119
-
120
-
121
-
122
-
123
-
124
-
125
-
126
-
127
-
128
-
129
-
130
-
131
-
132
-
133
-
134
-
135
-
136
-
137
-
138
-
139
-
140
-
141
-
142
-
143
-
144
-
145
-
146
-
147
-
148
-
149
-
150
-
151
-
152
-
153
-
154
-
155
-
156
-
157
-
158
-
159
-
160
-
161
-
162
-
163
-
164
-
165
-
166
-
167
-
168
-
169
-
170
-
171
-
172
-
173
-
174
-
175
-
176
-
177
-
178
-
179
-
 180
180 -
 181
181 -
 182
182 -
 183
183 -
 184
184 -
 185
185 -
 186
186 -
 187
187 -
 188
188 -
 189
189 -
 190
190 -
 191
191 -
 192
192 -
 193
193 -
 194
194 -
 195
195 -
 196
196 -
 197
197 -
 198
198 -
 199
199 -
 200
200 -
201
-
202
-
203
-
204
-
205
-
206
-
207
-
208
-
209
-
210
-
211
-
212
-
213
-
214
-
215
-
216
-
217
-
218
-
219
-
220
-
221
-
222
-
223
-
224
-
225
-
226
-
227
-
228
-
229
-
230
-
231
-
232
-
233
-
234
-
235
-
236
-
237
-
238
-
239
-
240
-
241
-
242
-
243
-
244
-
245
-
246
-
247
-
248
-
249
-
250
-
251
-
252
-
253
-
254
-
255
-
256
-
257
-
258
-
259
-
260
-
261
-
262
-
263
-
264
-
265
-
266
 |
 |

D
EPOSITS
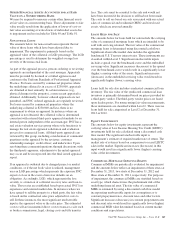
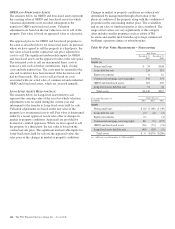
The carrying amounts of noninterest-bearing and interest-
bearing demand, interest-bearing money market and savings
deposits approximate fair values. For time deposits, which
include foreign deposits, fair values are estimated based on the
discounted value of expected net cash flows assuming current
interest rates. All deposits are classified as Level 2.
B
ORROWED
F
UNDS
The carrying amounts of Federal funds purchased, commercial
paper, repurchase agreements, trading securities sold short,
cash collateral, other short-term borrowings, acceptances
outstanding and accrued interest payable are considered to be
their fair value because of their short-term nature. For all other
borrowed funds, fair values are estimated using either prices
obtained from third-party vendors or an internally developed
discounted cash flow approach taking into consideration our
current incremental borrowing rates for similar instruments.
Also refer to the Fair Value Measurement and Fair Value
Option sections of this Note 9 regarding the fair value of
borrowed funds.
U
NFUNDED
L
OAN
C
OMMITMENTS
A
ND
L
ETTERS
O
F
C
REDIT
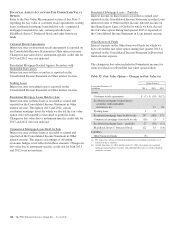
The fair value of unfunded loan commitments and letters of
credit is determined from a market participant’s view
including the impact of changes in interest rates and credit.
Because our obligation on substantially all unfunded loan
commitments and letters of credit varies with changes in
interest rates, these instruments are subject to little fluctuation
in fair value due to changes in interest rates. We establish a
liability on these facilities related to the creditworthiness of
our counterparty. These instruments are classified as Level 3.
F
INANCIAL
D
ERIVATIVES
Refer to the Fair Value Measurement section of this Note 9
regarding the fair value of financial derivatives.
N
OTE
10 G
OODWILL AND
O
THER
I
NTANGIBLE
A
SSETS
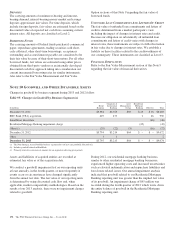
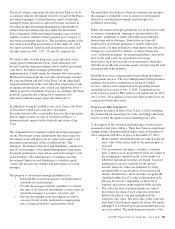
Changes in goodwill by business segment during 2013 and 2012 follow:
Table 95: Changes in Goodwill by Business Segment (a)
In millions
Retail
Banking
Corporate &
Institutional
Banking
Asset
Management
Group
Residential
Mortgage
Banking Other (b) Total
December 31, 2011 $5,394 $2,763 $69 $ 43 $ 16 $8,285
RBC Bank (USA) acquisition 429 473 2 46 950
SmartStreet divestiture (46) (46)
Residential Mortgage Banking impairment charge (45) (45)
Other (c) (29) (22) (5) (16) (72)
December 31, 2012 $5,794 $3,214 $64 $ – $ – $9,072
Other 11 2
December 31, 2013 $5,795 $3,215 $64 $ – $ – $9,074
(a) The Non-Strategic Assets Portfolio business segment does not have any goodwill allocated to it.
(b) Includes goodwill related to BlackRock.
(c) Primarily related to correction of amounts for an acquisition affecting prior periods.
Assets and liabilities of acquired entities are recorded at
estimated fair value as of the acquisition date.
We conduct a goodwill impairment test on our reporting units
at least annually, in the fourth quarter, or more frequently if
events occur or circumstances have changed significantly
from the annual test date. The fair value of our reporting units
is determined by using discounted cash flow and, when
applicable, market comparability methodologies. Based on the
results of our 2013 analysis, there were no impairment charges
related to goodwill.
During 2012, our residential mortgage banking business,
similar to other residential mortgage banking businesses,
experienced higher operating costs and increased uncertainties
such as elevated indemnification and repurchase liabilities and
foreclosure related issues. Our annual impairment analysis
indicated that goodwill related to our Residential Mortgage
Banking reporting unit was greater than the implied fair value
of its goodwill. An impairment charge of $45 million was
recorded during the fourth quarter of 2012 which wrote down
the entire balance of goodwill in the Residential Mortgage
Banking reporting unit.
172 The PNC Financial Services Group, Inc. – Form 10-K