PNC Bank 2013 Annual Report Download - page 129
Download and view the complete annual report
Please find page 129 of the 2013 PNC Bank annual report below. You can navigate through the pages in the report by either clicking on the pages listed below, or by using the keyword search tool below to find specific information within the annual report.-
 1
1 -
2
-
3
-
4
-
5
-
6
-
7
-
8
-
9
-
10
-
11
-
12
-
13
-
14
-
15
-
16
-
17
-
18
-
19
-
20
-
21
-
22
-
23
-
24
-
25
-
26
-
27
-
28
-
29
-
30
-
31
-
32
-
33
-
34
-
35
-
36
-
37
-
38
-
39
-
40
-
41
-
42
-
43
-
44
-
45
-
46
-
47
-
48
-
49
-
50
-
51
-
52
-
53
-
54
-
55
-
56
-
57
-
58
-
59
-
60
-
61
-
62
-
63
-
64
-
65
-
66
-
67
-
68
-
69
-
70
-
71
-
72
-
73
-
74
-
75
-
76
-
77
-
78
-
79
-
80
-
81
-
82
-
83
-
84
-
85
-
86
-
87
-
88
-
89
-
90
-
91
-
92
-
93
-
94
-
95
-
96
-
97
-
98
-
99
-
100
-
101
-
102
-
103
-
104
-
105
-
106
-
107
-
108
-
109
-
110
-
111
-
112
-
113
-
114
-
115
-
116
-
117
-
118
-
 119
119 -
 120
120 -
 121
121 -
 122
122 -
 123
123 -
 124
124 -
 125
125 -
 126
126 -
 127
127 -
 128
128 -
 129
129 -
 130
130 -
 131
131 -
 132
132 -
 133
133 -
 134
134 -
 135
135 -
 136
136 -
 137
137 -
 138
138 -
 139
139 -
140
-
141
-
142
-
143
-
144
-
145
-
146
-
147
-
148
-
149
-
150
-
151
-
152
-
153
-
154
-
155
-
156
-
157
-
158
-
159
-
160
-
161
-
162
-
163
-
164
-
165
-
166
-
167
-
168
-
169
-
170
-
171
-
172
-
173
-
174
-
175
-
176
-
177
-
178
-
179
-
180
-
181
-
182
-
183
-
184
-
185
-
186
-
187
-
188
-
189
-
190
-
191
-
192
-
193
-
194
-
195
-
196
-
197
-
198
-
199
-
200
-
201
-
202
-
203
-
204
-
205
-
206
-
207
-
208
-
209
-
210
-
211
-
212
-
213
-
214
-
215
-
216
-
217
-
218
-
219
-
220
-
221
-
222
-
223
-
224
-
225
-
226
-
227
-
228
-
229
-
230
-
231
-
232
-
233
-
234
-
235
-
236
-
237
-
238
-
239
-
240
-
241
-
242
-
243
-
244
-
245
-
246
-
247
-
248
-
249
-
250
-
251
-
252
-
253
-
254
-
255
-
256
-
257
-
258
-
259
-
260
-
261
-
262
-
263
-
264
-
265
-
266
 |
 |

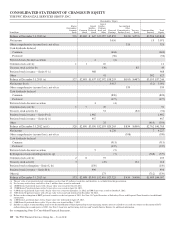
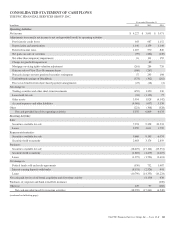
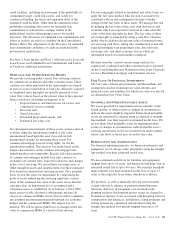
CONSOLIDATED STATEMENT OF CASH FLOWS
THE PNC FINANCIAL SERVICES GROUP, INC.
Year ended December 31
In millions 2013 2012 2011
Operating Activities
Net income $ 4,227 $ 3,001 $ 3,071
Adjustments to reconcile net income to net cash provided (used) by operating activities
Provision for credit losses 643 987 1,152
Depreciation and amortization 1,146 1,159 1,140
Deferred income taxes 1,207 570 840
Net gains on sales of securities (99) (204) (249)
Net other-than-temporary impairments 16 111 152
Charge for goodwill impairment 45
Mortgage servicing rights valuation adjustment (261) 284 726
Gain on sales of Visa Class B common shares (168) (267)
Noncash charges on trust preferred securities redemption 57 295 198
Undistributed earnings of BlackRock (373) (302) (262)
Excess tax benefits from share-based payment arrangements (23) (18) (2)
Net change in
Trading securities and other short-term investments (455) 1,350 330
Loans held for sale (94) (1,125) 77
Other assets 3,954 1,928 (4,142)
Accrued expenses and other liabilities (4,001) (697) 3,330
Other (221) (308) (328)
Net cash provided (used) by operating activities 5,555 6,809 6,033
Investing Activities
Sales
Securities available for sale 7,974 9,358 20,533
Loans 2,559 1,611 1,770
Repayments/maturities
Securities available for sale 9,668 9,195 6,074
Securities held to maturity 2,483 3,174 2,859
Purchases
Securities available for sale (18,419) (17,164) (25,551)
Securities held to maturity (1,883) (1,479) (1,607)
Loans (1,975) (1,796) (2,401)
Net change in
Federal funds sold and resale agreements (530) 732 1,487
Interest-earning deposits with banks (8,151) (2,526) 441
Loans (10,790) (14,333) (10,224)
Net cash paid for (received from) acquisition and divestiture activity (4,130) 430
Purchases of corporate and bank owned life insurance (200)
Other (a) 129 97 (160)
Net cash provided (used) by investing activities (18,935) (17,261) (6,549)
(continued on following page)
The PNC Financial Services Group, Inc. – Form 10-K 111