PNC Bank 2013 Annual Report Download - page 180
Download and view the complete annual report
Please find page 180 of the 2013 PNC Bank annual report below. You can navigate through the pages in the report by either clicking on the pages listed below, or by using the keyword search tool below to find specific information within the annual report.-
 1
1 -
2
-
3
-
4
-
5
-
6
-
7
-
8
-
9
-
10
-
11
-
12
-
13
-
14
-
15
-
16
-
17
-
18
-
19
-
20
-
21
-
22
-
23
-
24
-
25
-
26
-
27
-
28
-
29
-
30
-
31
-
32
-
33
-
34
-
35
-
36
-
37
-
38
-
39
-
40
-
41
-
42
-
43
-
44
-
45
-
46
-
47
-
48
-
49
-
50
-
51
-
52
-
53
-
54
-
55
-
56
-
57
-
58
-
59
-
60
-
61
-
62
-
63
-
64
-
65
-
66
-
67
-
68
-
69
-
70
-
71
-
72
-
73
-
74
-
75
-
76
-
77
-
78
-
79
-
80
-
81
-
82
-
83
-
84
-
85
-
86
-
87
-
88
-
89
-
90
-
91
-
92
-
93
-
94
-
95
-
96
-
97
-
98
-
99
-
100
-
101
-
102
-
103
-
104
-
105
-
106
-
107
-
108
-
109
-
110
-
111
-
112
-
113
-
114
-
115
-
116
-
117
-
118
-
119
-
120
-
121
-
122
-
123
-
124
-
125
-
126
-
127
-
128
-
129
-
130
-
131
-
132
-
133
-
134
-
135
-
136
-
137
-
138
-
139
-
140
-
141
-
142
-
143
-
144
-
145
-
146
-
147
-
148
-
149
-
150
-
151
-
152
-
153
-
154
-
155
-
156
-
157
-
158
-
159
-
160
-
161
-
162
-
163
-
164
-
165
-
166
-
167
-
168
-
169
-
 170
170 -
 171
171 -
 172
172 -
 173
173 -
 174
174 -
 175
175 -
 176
176 -
 177
177 -
 178
178 -
 179
179 -
 180
180 -
 181
181 -
 182
182 -
 183
183 -
 184
184 -
 185
185 -
 186
186 -
 187
187 -
 188
188 -
 189
189 -
 190
190 -
191
-
192
-
193
-
194
-
195
-
196
-
197
-
198
-
199
-
200
-
201
-
202
-
203
-
204
-
205
-
206
-
207
-
208
-
209
-
210
-
211
-
212
-
213
-
214
-
215
-
216
-
217
-
218
-
219
-
220
-
221
-
222
-
223
-
224
-
225
-
226
-
227
-
228
-
229
-
230
-
231
-
232
-
233
-
234
-
235
-
236
-
237
-
238
-
239
-
240
-
241
-
242
-
243
-
244
-
245
-
246
-
247
-
248
-
249
-
250
-
251
-
252
-
253
-
254
-
255
-
256
-
257
-
258
-
259
-
260
-
261
-
262
-
263
-
264
-
265
-
266
 |
 |
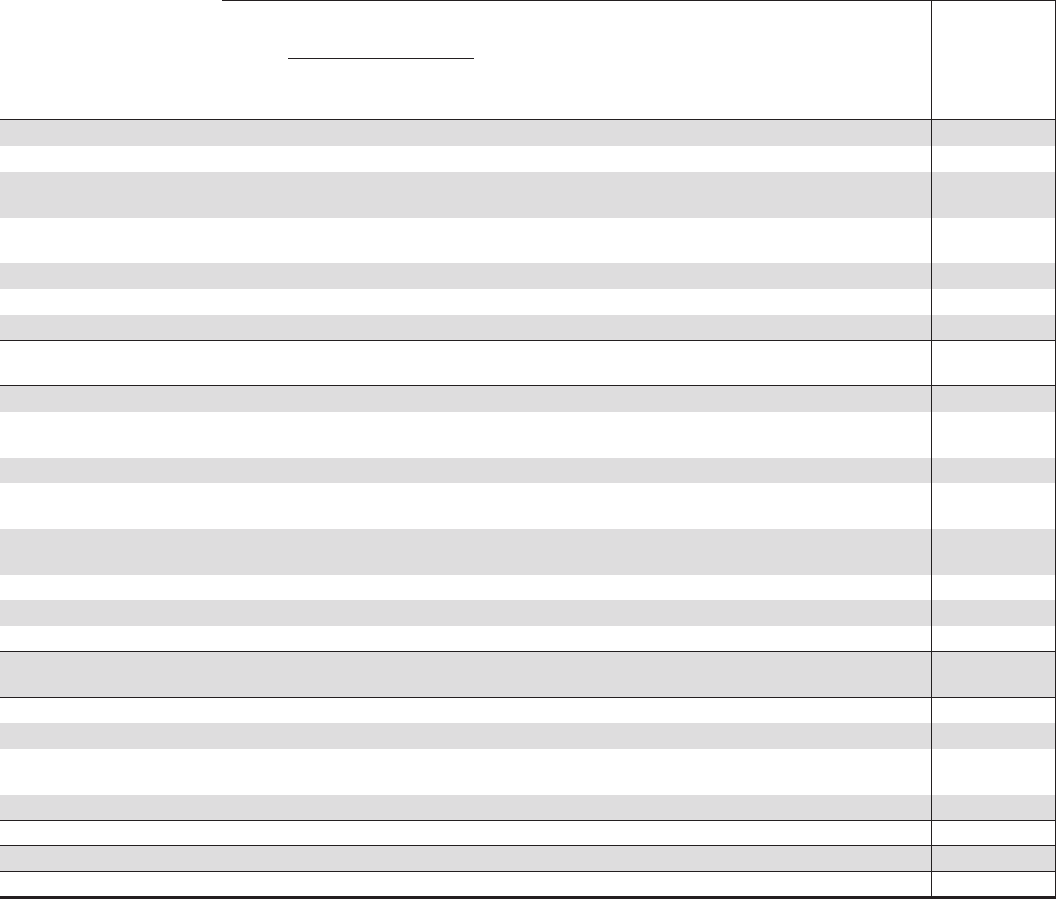
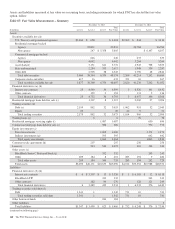
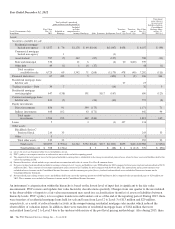
Year Ended December 31, 2012
Total realized / unrealized
gains or losses for the period (a)
Unrealized
gains (losses)
on assets and
liabilities held on
Consolidated
Balance Sheet
at Dec. 31,
2012 (c)
Level 3 Instruments Only
In millions
Fair Value
Dec. 31,
2011
Included in
Earnings
Included
in Other
comprehensive
income Purchases Sales Issuances Settlements
Transfers
into
Level 3 (b)
Transfers
out of
Level 3 (b)
Fair Value
Dec. 31,
2012
Assets
Securities available for sale
Residential mortgage-
backed non-agency $ 5,557 $ 76 $1,178 $ 49 $(164) $(1,047) $458 $ 6,107 $ (99)
Commercial mortgage
backed non-agency 1 (1)
Asset-backed 787 (7) 142 (87) (127) 708 (11)
State and municipal 336 21 6 (4) 20 $(40) 339
Other debt 49 (1) 1 16 (17) 48 (1)
Total securities
available for sale 6,729 69 1,342 71 (268) (1,179) 478 (40) 7,202 (111)
Financial derivatives 67 433 5 (400) 3 (2) 106 364
Residential mortgage loans
held for sale 27 27
Trading securities – Debt 39 7 (14) 32 3
Residential mortgage
servicing rights 647 (138) 191 $117 (167) 650 (123)
Commercial mortgage loans
held for sale 843 (5) (26) (40) 772 (8)
Equity investments
Direct investments 856 91 399 (175) 1,171 71
Indirect investments 648 102 63 (171) 642 94
Total equity
investments 1,504 193 462 (346) 1,813 165
Loans 5 3 (1) 127 134
Other assets
BlackRock Series C
Preferred Stock 210 33 243 33
Other 9 9
Total other assets 219 33 252 33
Total assets $10,053 $ 592(e) $1,342 $732 $(640) $117 $(1,801) $635 $(42) $10,988 $ 323(f)
Total liabilities (d) $ 308 $ 134(e) $ 3 $ (68) $ 1 $ (2) $ 376 $ 69(f)
(a) Losses for assets are bracketed while losses for liabilities are not.
(b) PNC’s policy is to recognize transfers in and transfers out as of the end of the reporting period.
(c) The amount of the total gains or losses for the period included in earnings that is attributable to the change in unrealized gains or losses related to those assets and liabilities held at the
end of the reporting period.
(d) Financial derivatives, which include swaps entered into in connection with sales of certain Visa Class B common shares.
(e) Net gains (realized and unrealized) included in earnings relating to Level 3 assets and liabilities were $920 million for 2013 compared with net gains (realized and unrealized) of $458
million for 2012. These amounts also included amortization and accretion of $217 million for 2013 compared with $189 for 2012. The amortization and accretion amounts were
included in Interest income on the Consolidated Income Statement, and the remaining net gains/(losses) (realized and unrealized) were included in Noninterest income on the
Consolidated Income Statement.
(f) Net unrealized gains relating to those assets and liabilities held at the end of the reporting period were $607 million for 2013, compared with net unrealized gains of $254 million for
2012. These amounts were included in Noninterest income on the Consolidated Income Statement.
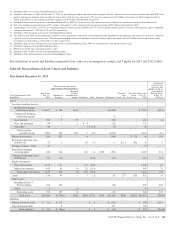
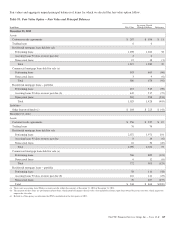
An instrument’s categorization within the hierarchy is based on the lowest level of input that is significant to the fair value
measurement. PNC reviews and updates fair value hierarchy classifications quarterly. Changes from one quarter to the next related
to the observability of inputs to a fair value measurement may result in a reclassification (transfer) of assets or liabilities between
hierarchy levels. PNC’s policy is to recognize transfers in and transfers out as of the end of the reporting period. During 2013, there
were transfers of residential mortgage loans held for sale and loans from Level 2 to Level 3 of $13 million and $29 million,
respectively, as a result of reduced market activity in the nonperforming residential mortgage sales market which reduced the
observability of valuation inputs. In addition, there were transfers of residential mortgage loans of $164 million that were
reclassified from Level 2 to Level 3 due to the unobservable nature of the pool level pricing methodology. Also during 2013, there
162 The PNC Financial Services Group, Inc. – Form 10-K