PNC Bank 2013 Annual Report Download - page 46
Download and view the complete annual report
Please find page 46 of the 2013 PNC Bank annual report below. You can navigate through the pages in the report by either clicking on the pages listed below, or by using the keyword search tool below to find specific information within the annual report.-
 1
1 -
2
-
3
-
4
-
5
-
6
-
7
-
8
-
9
-
10
-
11
-
12
-
13
-
14
-
15
-
16
-
17
-
18
-
19
-
20
-
21
-
22
-
23
-
24
-
25
-
26
-
27
-
28
-
29
-
30
-
31
-
32
-
33
-
34
-
35
-
 36
36 -
 37
37 -
 38
38 -
 39
39 -
 40
40 -
 41
41 -
 42
42 -
 43
43 -
 44
44 -
 45
45 -
 46
46 -
 47
47 -
 48
48 -
 49
49 -
 50
50 -
 51
51 -
 52
52 -
 53
53 -
 54
54 -
 55
55 -
 56
56 -
57
-
58
-
59
-
60
-
61
-
62
-
63
-
64
-
65
-
66
-
67
-
68
-
69
-
70
-
71
-
72
-
73
-
74
-
75
-
76
-
77
-
78
-
79
-
80
-
81
-
82
-
83
-
84
-
85
-
86
-
87
-
88
-
89
-
90
-
91
-
92
-
93
-
94
-
95
-
96
-
97
-
98
-
99
-
100
-
101
-
102
-
103
-
104
-
105
-
106
-
107
-
108
-
109
-
110
-
111
-
112
-
113
-
114
-
115
-
116
-
117
-
118
-
119
-
120
-
121
-
122
-
123
-
124
-
125
-
126
-
127
-
128
-
129
-
130
-
131
-
132
-
133
-
134
-
135
-
136
-
137
-
138
-
139
-
140
-
141
-
142
-
143
-
144
-
145
-
146
-
147
-
148
-
149
-
150
-
151
-
152
-
153
-
154
-
155
-
156
-
157
-
158
-
159
-
160
-
161
-
162
-
163
-
164
-
165
-
166
-
167
-
168
-
169
-
170
-
171
-
172
-
173
-
174
-
175
-
176
-
177
-
178
-
179
-
180
-
181
-
182
-
183
-
184
-
185
-
186
-
187
-
188
-
189
-
190
-
191
-
192
-
193
-
194
-
195
-
196
-
197
-
198
-
199
-
200
-
201
-
202
-
203
-
204
-
205
-
206
-
207
-
208
-
209
-
210
-
211
-
212
-
213
-
214
-
215
-
216
-
217
-
218
-
219
-
220
-
221
-
222
-
223
-
224
-
225
-
226
-
227
-
228
-
229
-
230
-
231
-
232
-
233
-
234
-
235
-
236
-
237
-
238
-
239
-
240
-
241
-
242
-
243
-
244
-
245
-
246
-
247
-
248
-
249
-
250
-
251
-
252
-
253
-
254
-
255
-
256
-
257
-
258
-
259
-
260
-
261
-
262
-
263
-
264
-
265
-
266
 |
 |

ITEM
6–
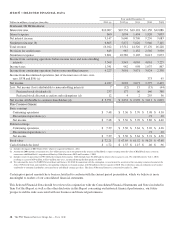
SELECTED FINANCIAL DATA
Year ended December 31
Dollars in millions, except per share data 2013 (a) 2012 (a) 2011 2010 2009
S
UMMARY
O
F
O
PERATIONS
Interest income $10,007 $10,734 $10,194 $11,150 $12,086
Interest expense 860 1,094 1,494 1,920 3,003
Net interest income 9,147 9,640 8,700 9,230 9,083
Noninterest income (b) 6,865 5,872 5,626 5,946 7,145
Total revenue 16,012 15,512 14,326 15,176 16,228
Provision for credit losses 643 987 1,152 2,502 3,930
Noninterest expense 9,801 10,582 9,105 8,613 9,073
Income from continuing operations before income taxes and noncontrolling
interests 5,568 3,943 4,069 4,061 3,225
Income taxes 1,341 942 998 1,037 867
Income from continuing operations before noncontrolling interests 4,227 3,001 3,071 3,024 2,358
Income from discontinued operations (net of income taxes of zero, zero,
zero, $338 and $54) (c) 373 45
Net income 4,227 3,001 3,071 3,397 2,403
Less: Net income (loss) attributable to noncontrolling interests 7 (12) 15 (15) (44)
Preferred stock dividends (d) 237 177 56 146 388
Preferred stock discount accretion and redemptions (d) 12 4 2 255 56
Net income attributable to common shareholders (d) $ 3,971 $ 2,832 $ 2,998 $ 3,011 $ 2,003
P
ER
C
OMMON
S
HARE
Basic earnings
Continuing operations $ 7.48 $ 5.36 $ 5.70 $ 5.08 $ 4.30
Discontinued operations (c) .72 .10
Net income $ 7.48 $ 5.36 $ 5.70 $ 5.80 $ 4.40
Diluted earnings
Continuing operations $ 7.39 $ 5.30 $ 5.64 $ 5.02 $ 4.26
Discontinued operations (c) .72 .10
Net income $ 7.39 $ 5.30 $ 5.64 $ 5.74 $ 4.36
Book value $ 72.21 $ 67.05 $ 61.52 $ 56.29 $ 47.68
Cash dividends declared $ 1.72 $ 1.55 $ 1.15 $ .40 $ .96
(a) Includes the impact of RBC Bank (USA), which we acquired on March 2, 2012.
(b) Amount for 2009 includes recognition of a $1.1 billion pretax gain on our portion of the increase in BlackRock’s equity resulting from the value of BlackRock shares issued in
connection with BlackRock’s acquisition of Barclays Global Investors (BGI) on December 1, 2009.
(c) Includes results of operations for PNC Global Investment Servicing Inc. (GIS) through June 30, 2010 and the related after-tax gain on sale. We sold GIS effective July 1, 2010,
resulting in a gain of $639 million, or $328 million after taxes, recognized during the third quarter of 2010.
(d) We redeemed the Series N (TARP) Preferred Stock on February 10, 2010. In connection with the redemption, we accelerated the accretion of the remaining issuance discount on the
Series N Preferred Stock and recorded a corresponding reduction in retained earnings of $250 million in the first quarter of 2010. This resulted in a noncash reduction in net income
attributable to common shareholders and related basic and diluted earnings per share. The Series N Preferred Stock was issued on December 31, 2008.
Certain prior period amounts have been reclassified to conform with the current period presentation, which we believe is more
meaningful to readers of our consolidated financial statements.
This Selected Financial Data should be reviewed in conjunction with the Consolidated Financial Statements and Notes included in
Item 8 of this Report as well as the other disclosure in this Report concerning our historical financial performance, our future
prospects and the risks associated with our business and financial performance.
28 The PNC Financial Services Group, Inc. – Form 10-K