PNC Bank 2013 Annual Report Download - page 77
Download and view the complete annual report
Please find page 77 of the 2013 PNC Bank annual report below. You can navigate through the pages in the report by either clicking on the pages listed below, or by using the keyword search tool below to find specific information within the annual report.-
 1
1 -
2
-
3
-
4
-
5
-
6
-
7
-
8
-
9
-
10
-
11
-
12
-
13
-
14
-
15
-
16
-
17
-
18
-
19
-
20
-
21
-
22
-
23
-
24
-
25
-
26
-
27
-
28
-
29
-
30
-
31
-
32
-
33
-
34
-
35
-
36
-
37
-
38
-
39
-
40
-
41
-
42
-
43
-
44
-
45
-
46
-
47
-
48
-
49
-
50
-
51
-
52
-
53
-
54
-
55
-
56
-
57
-
58
-
59
-
60
-
61
-
62
-
63
-
64
-
65
-
66
-
 67
67 -
 68
68 -
 69
69 -
 70
70 -
 71
71 -
 72
72 -
 73
73 -
 74
74 -
 75
75 -
 76
76 -
 77
77 -
 78
78 -
 79
79 -
 80
80 -
 81
81 -
 82
82 -
 83
83 -
 84
84 -
 85
85 -
 86
86 -
 87
87 -
88
-
89
-
90
-
91
-
92
-
93
-
94
-
95
-
96
-
97
-
98
-
99
-
100
-
101
-
102
-
103
-
104
-
105
-
106
-
107
-
108
-
109
-
110
-
111
-
112
-
113
-
114
-
115
-
116
-
117
-
118
-
119
-
120
-
121
-
122
-
123
-
124
-
125
-
126
-
127
-
128
-
129
-
130
-
131
-
132
-
133
-
134
-
135
-
136
-
137
-
138
-
139
-
140
-
141
-
142
-
143
-
144
-
145
-
146
-
147
-
148
-
149
-
150
-
151
-
152
-
153
-
154
-
155
-
156
-
157
-
158
-
159
-
160
-
161
-
162
-
163
-
164
-
165
-
166
-
167
-
168
-
169
-
170
-
171
-
172
-
173
-
174
-
175
-
176
-
177
-
178
-
179
-
180
-
181
-
182
-
183
-
184
-
185
-
186
-
187
-
188
-
189
-
190
-
191
-
192
-
193
-
194
-
195
-
196
-
197
-
198
-
199
-
200
-
201
-
202
-
203
-
204
-
205
-
206
-
207
-
208
-
209
-
210
-
211
-
212
-
213
-
214
-
215
-
216
-
217
-
218
-
219
-
220
-
221
-
222
-
223
-
224
-
225
-
226
-
227
-
228
-
229
-
230
-
231
-
232
-
233
-
234
-
235
-
236
-
237
-
238
-
239
-
240
-
241
-
242
-
243
-
244
-
245
-
246
-
247
-
248
-
249
-
250
-
251
-
252
-
253
-
254
-
255
-
256
-
257
-
258
-
259
-
260
-
261
-
262
-
263
-
264
-
265
-
266
 |
 |
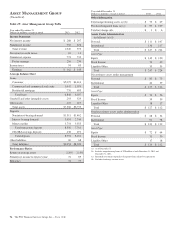
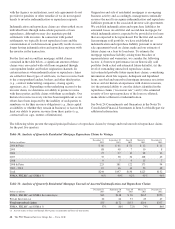
Residential Mortgage Banking earned $148 million in 2013
compared with a net loss of $308 million in 2012. Earnings
increased from the prior year as a result of the improvement in
the provision for residential mortgage repurchase obligations
and lower noninterest expense, partially offset by lower loan
sales revenue.
The strategic focus of the business is the acquisition of new
customers through a retail loan officer sales force with an
emphasis on home purchase transactions. Our strategy
involves competing on the basis of superior service to new
and existing customers in serving their home purchase and
refinancing needs. A key consideration in pursuing this
approach is the cross-sell opportunity, especially in the bank
footprint markets.
Residential Mortgage Banking overview:
• Total loan originations were $15.1 billion in 2013
compared with $15.2 billion in 2012. Loans continue
to be originated primarily through direct channels
under Federal National Mortgage Association
(FNMA), Federal Home Loan Mortgage Corporation
(FHLMC) and Federal Housing Administration
(FHA)/Department of Veterans Affairs (VA) agency
guidelines. Refinancings were 70% of originations
for 2013 and 77% in 2012. During 2013, 32% of loan
originations were under the original or revised Home
Affordable Refinance Program (HARP or HARP 2).
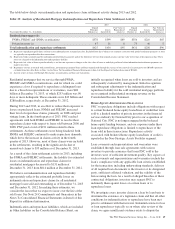
• Investors having purchased mortgage loans may
request PNC to indemnify them against losses on
certain loans or to repurchase loans that they believe
do not comply with applicable contractual loan
origination covenants and representations and
warranties we have made. At December 31, 2013, the
liability for estimated losses on repurchase and
indemnification claims for the Residential Mortgage
Banking business segment was $131 million
compared with $614 million at December 31, 2012.
See the Recourse and Repurchase Obligations section
of this Item 7 and Note 24 Commitments and
Guarantees in the Notes to Consolidated Financial
Statements of Item 8 of this Report for additional
information.
– During the fourth quarter of 2013, settlements
were reached with both FNMA and FHLMC
regarding repurchase claims on 2008 and prior
vintage loans. As a result of these settlements, a
net reserve release of $124 million was recorded.
• Residential mortgage loans serviced for others totaled
$114 billion at December 31, 2013 and $119 billion
at December 31, 2012 as payoffs continued to
outpace new direct loan origination volume and
acquisitions.
• Noninterest income was $906 million in 2013
compared with $317 million in 2012. Declines in
loan sales revenue and servicing fees were more than
offset by the improvement in the provision for
residential mortgage repurchase obligations. The
decline in loan sales revenue resulted from an
increase in mortgage interest rates which had the
effect of reducing gain on sale margins and, to a
lesser extent, loan origination volume.
• Noninterest expense was $845 million in 2013
compared with $992 million in 2012, driven
primarily by reduced mortgage foreclosure-related
expenses. Also, goodwill impairment of $45 million
was recorded in 2012.
• The fair value of mortgage servicing rights was $1.1
billion at December 31, 2013 compared with $.7
billion at December 31, 2012. The increase was due
to higher mortgage interest rates at December 31,
2013.
The PNC Financial Services Group, Inc. – Form 10-K 59