PNC Bank 2013 Annual Report Download - page 244
Download and view the complete annual report
Please find page 244 of the 2013 PNC Bank annual report below. You can navigate through the pages in the report by either clicking on the pages listed below, or by using the keyword search tool below to find specific information within the annual report.-
 1
1 -
2
-
3
-
4
-
5
-
6
-
7
-
8
-
9
-
10
-
11
-
12
-
13
-
14
-
15
-
16
-
17
-
18
-
19
-
20
-
21
-
22
-
23
-
24
-
25
-
26
-
27
-
28
-
29
-
30
-
31
-
32
-
33
-
34
-
35
-
36
-
37
-
38
-
39
-
40
-
41
-
42
-
43
-
44
-
45
-
46
-
47
-
48
-
49
-
50
-
51
-
52
-
53
-
54
-
55
-
56
-
57
-
58
-
59
-
60
-
61
-
62
-
63
-
64
-
65
-
66
-
67
-
68
-
69
-
70
-
71
-
72
-
73
-
74
-
75
-
76
-
77
-
78
-
79
-
80
-
81
-
82
-
83
-
84
-
85
-
86
-
87
-
88
-
89
-
90
-
91
-
92
-
93
-
94
-
95
-
96
-
97
-
98
-
99
-
100
-
101
-
102
-
103
-
104
-
105
-
106
-
107
-
108
-
109
-
110
-
111
-
112
-
113
-
114
-
115
-
116
-
117
-
118
-
119
-
120
-
121
-
122
-
123
-
124
-
125
-
126
-
127
-
128
-
129
-
130
-
131
-
132
-
133
-
134
-
135
-
136
-
137
-
138
-
139
-
140
-
141
-
142
-
143
-
144
-
145
-
146
-
147
-
148
-
149
-
150
-
151
-
152
-
153
-
154
-
155
-
156
-
157
-
158
-
159
-
160
-
161
-
162
-
163
-
164
-
165
-
166
-
167
-
168
-
169
-
170
-
171
-
172
-
173
-
174
-
175
-
176
-
177
-
178
-
179
-
180
-
181
-
182
-
183
-
184
-
185
-
186
-
187
-
188
-
189
-
190
-
191
-
192
-
193
-
194
-
195
-
196
-
197
-
198
-
199
-
200
-
201
-
202
-
203
-
204
-
205
-
206
-
207
-
208
-
209
-
210
-
211
-
212
-
213
-
214
-
215
-
216
-
217
-
218
-
219
-
220
-
221
-
222
-
223
-
224
-
225
-
226
-
227
-
228
-
229
-
230
-
231
-
232
-
233
-
 234
234 -
 235
235 -
 236
236 -
 237
237 -
 238
238 -
 239
239 -
 240
240 -
 241
241 -
 242
242 -
 243
243 -
 244
244 -
 245
245 -
 246
246 -
 247
247 -
 248
248 -
 249
249 -
 250
250 -
 251
251 -
 252
252 -
 253
253 -
 254
254 -
255
-
256
-
257
-
258
-
259
-
260
-
261
-
262
-
263
-
264
-
265
-
266
 |
 |

T
ANGIBLE
B
OOK
V
ALUE PER
C
OMMON
S
HARE
R
ATIO
(N
ON
-GAAP)
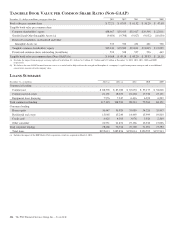
December 31 – dollars in millions, except per share data 2013 2012 2011 2010 2009
Book value per common share $ 72.21 $ 67.05 $ 61.52 $ 56.29 $ 47.68
Tangible book value per common share
Common shareholders’ equity $38,467 $35,413 $32,417 $29,596 $ 22,011
Goodwill and Other Intangible Assets (a) (9,654) (9,798) (9,027) (9,052) (10,650)
Deferred tax liabilities on Goodwill and Other
Intangible Assets (a) 333 354 431 461 738
Tangible common shareholders’ equity $29,146 $25,969 $23,821 $21,005 $ 12,099
Period-end common shares outstanding (in millions) 533 528 527 526 462
Tangible book value per common share (Non-GAAP) (b) $ 54.68 $ 49.18 $ 45.20 $ 39.93 $ 26.19
(a) Excludes the impact from mortgage servicing rights of $1.6 billion, $1.1 billion, $1.1 billion, $1.7 billion and $2.3 billion at December 31, 2013, 2012, 2011, 2010 and 2009,
respectively.
(b) We believe this non-GAAP financial measure serves as a useful tool to help evaluate the strength and discipline of a company’s capital management strategies and as an additional
conservative measure of total company value.
L
OANS
S
UMMARY
December 31 – in millions 2013 (a) 2012 (a) 2011 2010 2009
Commercial lending
Commercial $ 88,378 $ 83,040 $ 65,694 $ 55,177 $ 54,818
Commercial real estate 21,191 18,655 16,204 17,934 23,131
Equipment lease financing 7,576 7,247 6,416 6,393 6,202
Total commercial lending 117,145 108,942 88,314 79,504 84,151
Consumer lending
Home equity 36,447 35,920 33,089 34,226 35,947
Residential real estate 15,065 15,240 14,469 15,999 19,810
Credit card 4,425 4,303 3,976 3,920 2,569
Other consumer 22,531 21,451 19,166 16,946 15,066
Total consumer lending 78,468 76,914 70,700 71,091 73,392
Total loans $195,613 $185,856 $159,014 $150,595 $157,543
(a) Includes the impact of the RBC Bank (USA) acquisition, which we acquired on March 2, 2012.
226 The PNC Financial Services Group, Inc. – Form 10-K