PNC Bank 2013 Annual Report Download - page 150
Download and view the complete annual report
Please find page 150 of the 2013 PNC Bank annual report below. You can navigate through the pages in the report by either clicking on the pages listed below, or by using the keyword search tool below to find specific information within the annual report.-
 1
1 -
2
-
3
-
4
-
5
-
6
-
7
-
8
-
9
-
10
-
11
-
12
-
13
-
14
-
15
-
16
-
17
-
18
-
19
-
20
-
21
-
22
-
23
-
24
-
25
-
26
-
27
-
28
-
29
-
30
-
31
-
32
-
33
-
34
-
35
-
36
-
37
-
38
-
39
-
40
-
41
-
42
-
43
-
44
-
45
-
46
-
47
-
48
-
49
-
50
-
51
-
52
-
53
-
54
-
55
-
56
-
57
-
58
-
59
-
60
-
61
-
62
-
63
-
64
-
65
-
66
-
67
-
68
-
69
-
70
-
71
-
72
-
73
-
74
-
75
-
76
-
77
-
78
-
79
-
80
-
81
-
82
-
83
-
84
-
85
-
86
-
87
-
88
-
89
-
90
-
91
-
92
-
93
-
94
-
95
-
96
-
97
-
98
-
99
-
100
-
101
-
102
-
103
-
104
-
105
-
106
-
107
-
108
-
109
-
110
-
111
-
112
-
113
-
114
-
115
-
116
-
117
-
118
-
119
-
120
-
121
-
122
-
123
-
124
-
125
-
126
-
127
-
128
-
129
-
130
-
131
-
132
-
133
-
134
-
135
-
136
-
137
-
138
-
139
-
 140
140 -
 141
141 -
 142
142 -
 143
143 -
 144
144 -
 145
145 -
 146
146 -
 147
147 -
 148
148 -
 149
149 -
 150
150 -
 151
151 -
 152
152 -
 153
153 -
 154
154 -
 155
155 -
 156
156 -
 157
157 -
 158
158 -
 159
159 -
 160
160 -
161
-
162
-
163
-
164
-
165
-
166
-
167
-
168
-
169
-
170
-
171
-
172
-
173
-
174
-
175
-
176
-
177
-
178
-
179
-
180
-
181
-
182
-
183
-
184
-
185
-
186
-
187
-
188
-
189
-
190
-
191
-
192
-
193
-
194
-
195
-
196
-
197
-
198
-
199
-
200
-
201
-
202
-
203
-
204
-
205
-
206
-
207
-
208
-
209
-
210
-
211
-
212
-
213
-
214
-
215
-
216
-
217
-
218
-
219
-
220
-
221
-
222
-
223
-
224
-
225
-
226
-
227
-
228
-
229
-
230
-
231
-
232
-
233
-
234
-
235
-
236
-
237
-
238
-
239
-
240
-
241
-
242
-
243
-
244
-
245
-
246
-
247
-
248
-
249
-
250
-
251
-
252
-
253
-
254
-
255
-
256
-
257
-
258
-
259
-
260
-
261
-
262
-
263
-
264
-
265
-
266
 |
 |

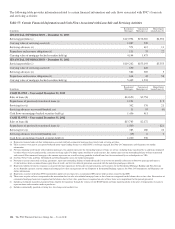
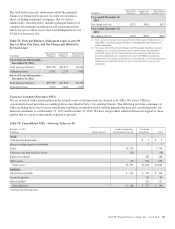
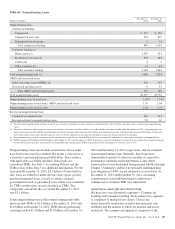
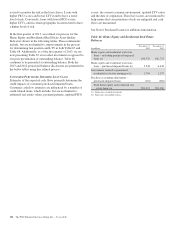
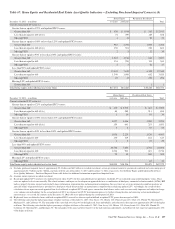
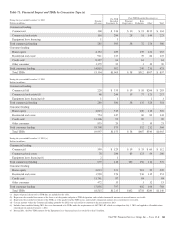
The following tables display the delinquency status of our loans and our nonperforming assets at December 31, 2013 and
December 31, 2012, respectively.
Table 63: Analysis of Loan Portfolio (a)
Accruing
In millions
Current or
Less
Than 30
Days
Past Due
30-59
Days
Past Due
60-89 Days
Past Due
90 Days
Or More
Past Due
Total Past
Due (b)
Nonperforming
Loans
Fair Value Option
Nonaccrual
Loans (c)
Purchased
Impaired
Total
Loans
December 31, 2013
Commercial $ 87,621 $ 81 $ 20 $ 42 $ 143 $ 457 $ 157 $ 88,378
Commercial real estate 20,090 54 11 2 67 518 516 21,191
Equipment lease financing 7,538 31 2 33 5 7,576
Home equity (d) 32,877 86 34 120 1,139 2,311 36,447
Residential real estate (d) (e) 9,311 217 87 1,060 1,364 904 $365 3,121 15,065
Credit card 4,339 29 19 34 82 4 4,425
Other consumer (d) (f) 21,788 216 112 353 681 61 1 22,531
Total $183,564 $714 $285 $1,491 $2,490 $3,088 $365 $6,106 $195,613
Percentage of total loans 93.83% .37% .15% .76% 1.28% 1.58% .19% 3.12% 100.00%
December 31, 2012
Commercial $ 81,930 $115 $ 55 $ 42 $ 212 $ 590 $ 308 $ 83,040
Commercial real estate 16,735 100 57 15 172 807 941 18,655
Equipment lease financing 7,214 17 1 2 20 13 7,247
Home equity 32,174 117 58 175 951 2,620 35,920
Residential real estate (e) 8,464 278 146 1,901 2,325 845 $ 70 3,536 15,240
Credit card 4,205 34 23 36 93 5 4,303
Other consumer (f) 20,663 258 131 355 744 43 1 21,451
Total $171,385 $919 $471 $2,351 $3,741 $3,254 $ 70 $7,406 $185,856
Percentage of total loans 92.21% .49% .25% 1.26% 2.00% 1.75% .05% 3.99% 100.00%
(a) Amounts in table represent recorded investment and exclude loans held for sale.
(b) Past due loan amounts exclude purchased impaired loans, even if contractually past due (or if we do not expect to receive payment in full based on the original contractual terms), as
we are currently accreting interest income over the expected life of the loans.
(c) Consumer loans accounted for under the fair value option for which we do not expect to collect substantially all principal and interest are subject to nonaccrual accounting and
classification upon meeting any of our nonaccrual policies. Given that these loans are not accounted for at amortized cost, these loans have been excluded from the nonperforming
loan population.
(d) Pursuant to alignment with interagency supervisory guidance on practices for loans and lines of credit related to consumer lending in the first quarter of 2013, accruing consumer loans
past due 30 – 59 days decreased $44 million, accruing consumer loans past due 60 – 89 days decreased $36 million and accruing consumer loans past due 90 days or more decreased
$315 million, of which $295 million related to Residential real estate government insured loans. As part of this alignment, these loans were moved into nonaccrual status.
(e) Past due loan amounts at December 31, 2013 include government insured or guaranteed Residential real estate mortgages totaling $.1 billion for 30 to 59 days past due, $.1 billion for
60 to 89 days past due and $1.0 billion for 90 days or more past due. Past due loan amounts at December 31, 2012 include government insured or guaranteed Residential real estate
mortgages totaling $.1 billion for 30 to 59 days past due, $.1 billion for 60 to 89 days past due and $1.9 billion for 90 days or more past due.
(f) Past due loan amounts at December 31, 2013 include government insured or guaranteed Other consumer loans totaling $.2 billion for 30 to 59 days past due, $.1 billion for 60 to 89
days past due and $.3 billion for 90 days or more past due. Past due loan amounts at December 31, 2012 include government insured or guaranteed Other consumer loans totaling $.2
billion for 30 to 59 days past due, $.1 billion for 60 to 89 days past due and $.3 billion for 90 days or more past due.
132 The PNC Financial Services Group, Inc. – Form 10-K